If you want a high-level view of the solar spectrum, check out the “Solar Simulation Starting with Our Sun a G2V Star” chapter from our YouTube video on Solar Simulation and LEDs: Multi-Source Lighting for Advancing Future Technologies. If you are looking to gather deep technical knowledge on the subject continue reading.
What is Sunlight?
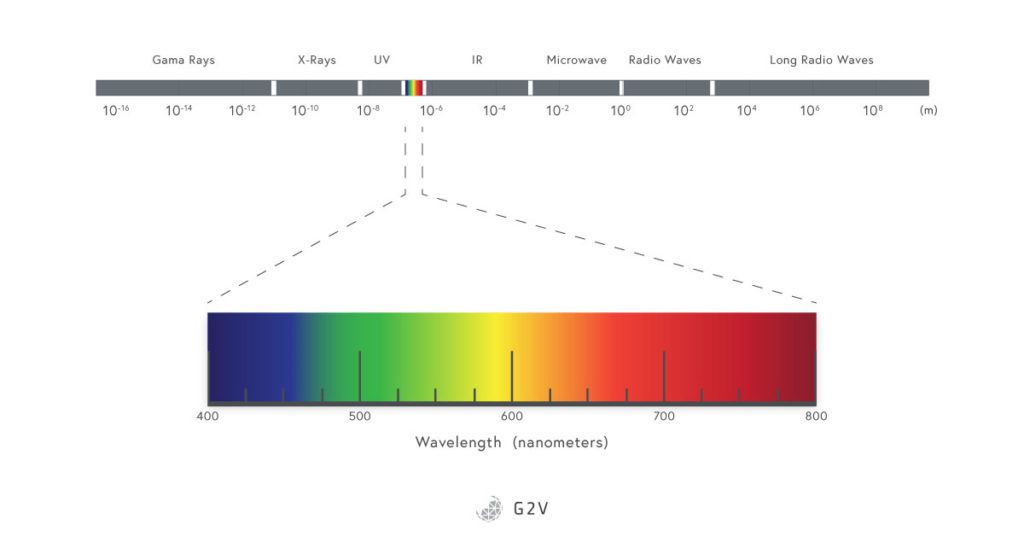
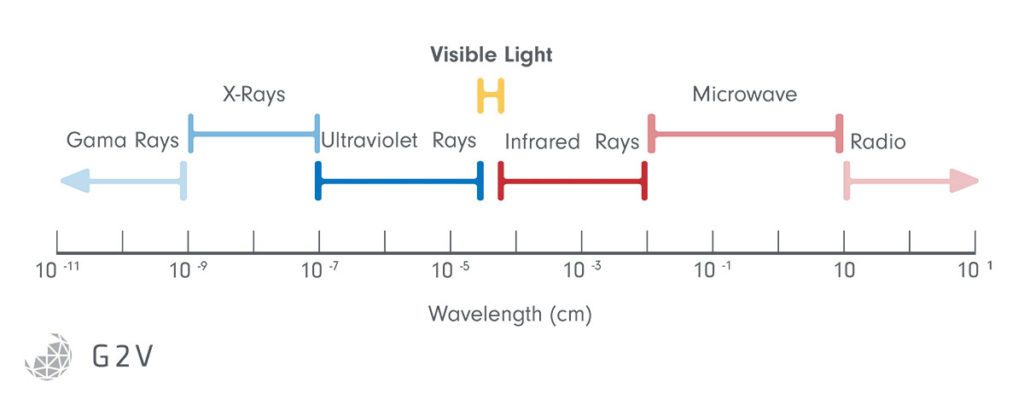
Sunlight is composed of waves of different lengths (hence the term wavelength), and some of these waves represent the colors we see. The sun emits almost all wavelengths of light, even some that we can not perceive with our human eyes, such as radio waves, microwaves, infrared (IR), ultraviolet (UV), X-rays and gamma rays.
Similar to the element in your stove or oven, the sun emits light because of its temperature. We can closely approximate the sun’s surface temperature to be about 5800 Kelvin (K), or 5500 Celsius (C).
Sunlight comes from the energy emitted in the form of electromagnetic radiation given off of the hot surface of the sun. So the sun’s radiation spectrum matches a 5800 K blackbody.
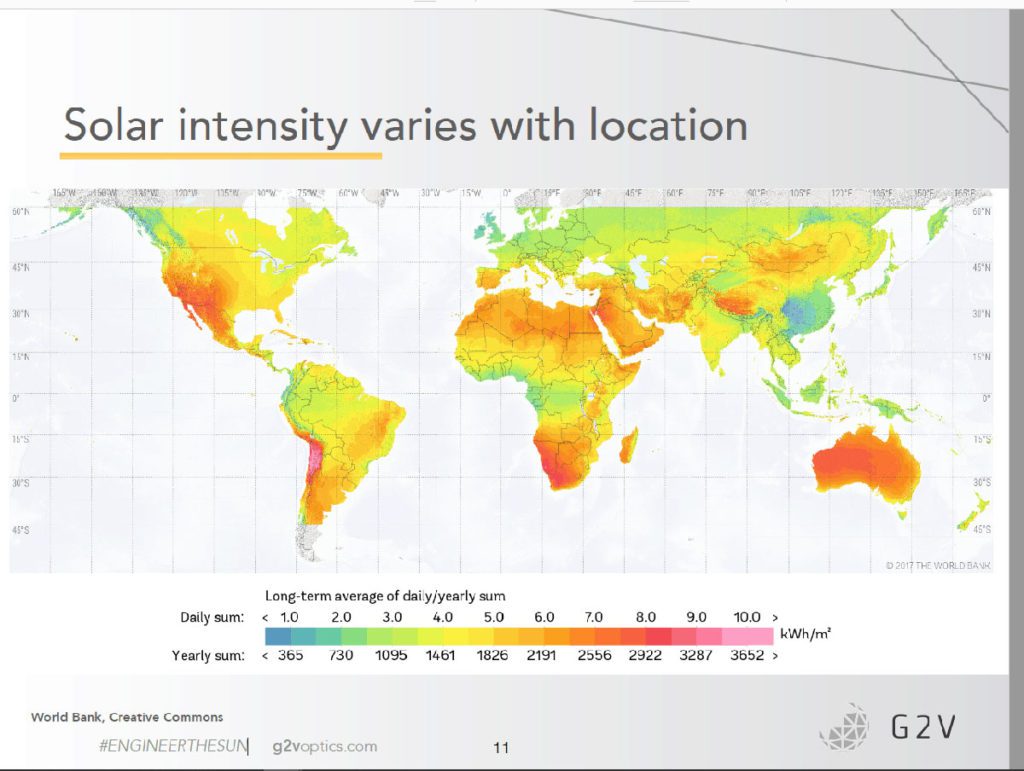
The amount of sunlight falling on the earth’s atmosphere changes over a year by about 6.6% due to the variation in the earth/sun distance, and solar activity variations cause sunlight to change up to 1%. Additionally, all the radiation that reaches the ground passes through the atmosphere, which modifies the spectrum by absorption and scattering. As we can see, the specific physical and spectroscopic properties of sunlight are different in different parts of the world, year, day, and even altitude. In addition, due to the Earth’s curved surface, the sun’s radiation that reaches the Earth’s surface does not strike all areas of the planet at the same angle. For example, when the sun is nearly overhead, it hits directly near the equator but more obliquely near the poles.
Before anyone can start reproducing sunlight, they have to have a way of measuring and talking about it. There are two main methods of counting and quantifying light, known as radiometry and photometry. Read all about it in our How to Measure Light article here.
What Is the Solar Spectrum? A Look at Sunlight and Radiation
Solar spectrum is defined as the electromagnetic spectral distribution emitted by the sun or received by a collector or instrument on Earth.
The sun radiates solar energy or sunlight by electromagnetic waves over a range of wavelengths known as the Solar Spectrum.
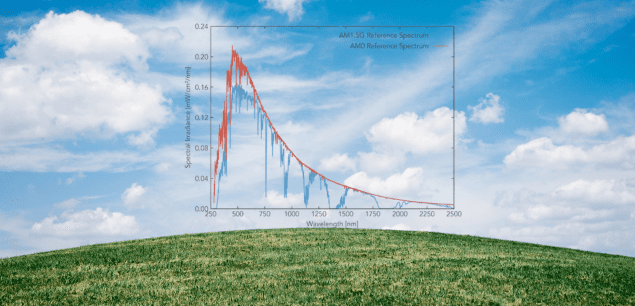
The Sun emits radiation from X-rays to radio waves, but the surface of the Earth receives mainly wavelengths between 350 nm and 4000 nm. The region visible to humans is restricted to 400 nm to 700 nm, approximately 43% of the total energy.
The solar spectrum is generated by the sun’s surface, which, as we discussed, can be modelled by a black body of 5800 K. As we also mentioned, the spectrum we get at the Earth’s surface is modified because of atmospheric absorption and scattering.
Complex atmospheric processes may considerably modify the solar spectrum that reaches the earth’s surface. For example, gas-phase H2O and CO2 are strong absorbers of solar infrared radiation.
Solar Spectrum and the Effects of Molecular Absorption
Molecules have many different ways of absorbing light. When they absorb light, that energy is converted into another form. That energy can be converted into a molecule’s vibrational, rotational or electronic energies, and the exact wavelengths of light it will respond to depend on the molecule in question.
Water vapour, for example, experiences rotational absorption in the microwave and infrared and vibrational absorption in the near and mid-infrared wavelengths. It also experiences electronic absorption (where an electron is boosted to a higher energy state) in ultraviolet wavelengths.
Carbon dioxide, oxygen, and other molecules each have a unique absorption spectrum that impacts the spectrum of sunlight we see. Some examples of absorption spectra are given below.
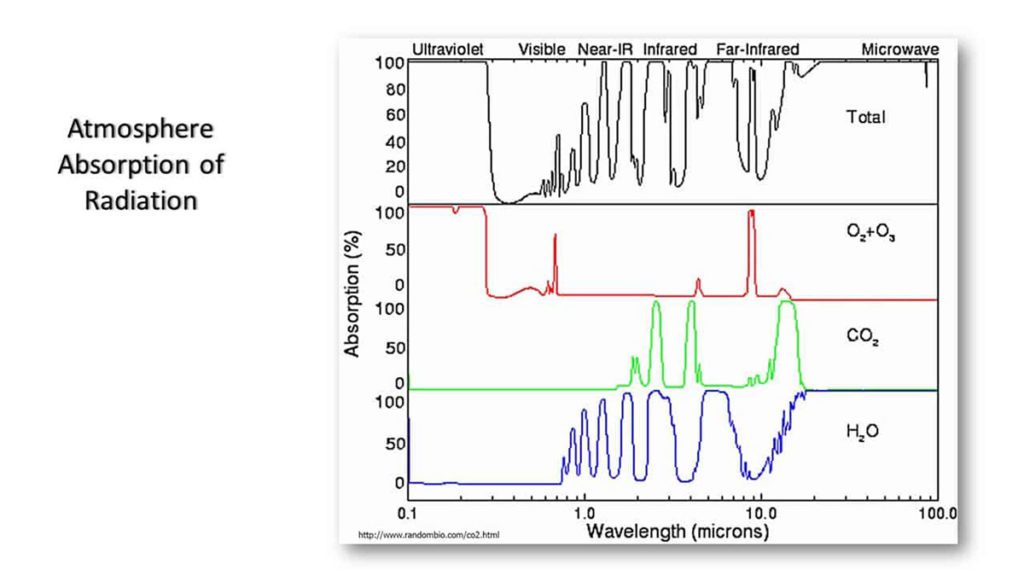
Other Ways the Solar Spectrum is Modified
In the visible range, precipitation, clouds, and sandstorms reduce solar radiation. Because most ultraviolet radiation is absorbed from the solar spectrum and does not reach the earth’s surface, the peak of the solar radiation that reaches the earth’s surface is in the visible part of the spectrum. Of the total radiation, about 3/4 ultimately reaches the earth. The energy distribution of the solar spectrum is approximately 5% UV, 43% visible and 52% infrared.
In summary, the sunlight varies because of solar activity, Earth-sun distance, precipitation, solar angle, clouds, sandstorms and more. You can probably appreciate how it’s difficult to give a simple answer to “how much sunlight do we get” when it depends on so many variables!
If we want any hope of recreating sunlight, we have to have a basis to start from, though. To be able to consistently test photochemical processes or solar cells in a lab setting, for example, we need to have a reliable, reproducible and controllable source of light.
Source: Wiki Commons – Solar Spectrum
Exploring the Solar Irradiance on Earth
When talking about the amount of sunlight falling on the Earth, irradiance is the quantity used, and is the light power per unit area. The solar irradiance received by Earth’s atmosphere changes over a year by about 6.6% due to slight variations in the Earth/Sun distance. The sun’s activity changes result in emission variations of up to 1%.
Before light even enters our atmosphere, then, there’s variation in how much Earth receives.
Practically, though, we’re interested in the light that reaches the ground, which means light that has to pass through our atmosphere. The atmosphere modifies the spectrum by absorbing and scattering light.
Additionally, due to the Earth’s curved surface, the sun’s radiation reaching the surface does not strike all areas of the planet at the same angle. Depending on the angle of the Sun, light will have to travel through more or less atmosphere, and the absorption and scatter will change. For example, when the sun is highest at noon in a timezone, it is directly overhead near the equator but more oblique near the poles. The position of the Sun throughout the day will also change depending on the season because of the Earth’s axial tilt.
The amount of sunlight falling on the earth’s atmosphere changes over a year by about 6.6% due to the variation in the earth/sun distance, and solar activity variations cause sunlight to change up to 1%
Even though our eyes only perceive the visible portion of the electromagnetic spectrum, other wavelengths produced by the sun (such as UV or IR) also play an important role in many photochemical processes. For example, depending on the type of chlorophyll, plants can absorb wavelengths that range from UV to IR to produce useful energy. Additionally, materials (organic or inorganic) can be designed to absorb light in a broad spectrum of wavelengths, even outside of visible light.
As we can see, the answers to what sunlight is and how much sunlight we get are not straightforward.
To consistently test photochemical processes in a lab setting, we need a standard definition of sunlight and a reliable and controllable source of light. Artificial light, provided by solar simulators, allows you to mimic the sunlight spectra that meet international standards, which is needed to have consistent and reproducible experiments.
We’ve given ourselves some tools to meaningfully discuss and quantify light. However, to fully answer how much sunlight the Earth gets, we need to understand more about the air mass (AM) spectrum.
Our next chapter covers everything about the air mass spectrum on and off the Earth.
