In our modern era, nearly every industry has standards that set baselines for ensuring its associated products are safe and suitable to perform intended tasks. Solar simulation – reproducing sunlight – is no different, having standards that specify the requirements for solar simulators, and lay out the rules determining whether a solar simulator is Class AAA, Class ABA, Class CBC, and so on.
Just as humanity’s understanding of materials science and human health leads to regularly-updated standards for the production of safe food, our understanding of sunlight and its interactions with various materials leads to updates in the standards required for good solar simulation.
This article’s purpose is to describe the meaning and motivation behind the major changes introduced in the 2020 update to the IEC 60904-9 standard, “Classification of solar simulator characteristics.” While there have been regular updates to many of the solar simulation standards, the IEC 60904-9:2020 has a few key changes that have a significant impact on both users and manufacturers of solar simulators.
Here are the key changes that will be discussed in more detail in this article:
- Until now, the highest possible rating for a solar simulator was Class AAA. The IEC 60904-9 introduces the A+ classification in all three metrics of spectral match, spatial non-uniformity and temporal instability.
- The new standard also extends the required wavelength range for solar simulators to claim Class A+. Before, 400 nm to 1100 nm was sufficient for reproducing 1 sun. Now, a solar simulator needs to be evaluated against the 300 nm to 1200 nm requirements to claim Class A+ classification under the new standard.
- Finally, the standard introduces two entirely new metrics: spectral coverage and spectral deviation. While these metrics are not yet required for solar simulator classification, they are expected to become standard parts of the diction in solar simulator applications, especially for LED solar simulators.
Why are Solar Simulator Standards Changing?
New Solar Cell Materials and Architectures
One key application for solar simulators is testing solar cells, aka photovoltaic devices. Indeed, when ASTM subcommittee EE44.09 was formed in 1978, they recognized that a key way to improve confidence in photovoltaic efficiency measurements was to standardize the metrics for solar simulators. So, they wrote “Specifications of Solar Simulators for Terrestrial Photovoltaics Testing” (which is the ASTM E927 standard). This was the first standard to define how solar simulators should be measured and classified.
This American standard was eventually followed by standards in the rest of the world, such as the International Electrotechnical Commission (IEC)’s 60904-9 in 1995, which is part of a broader set of requirements for photovoltaic testing. The point of all this background is to emphasize that, from their creation, solar simulators have been intimately linked to the development and testing of photovoltaic devices.
The photovoltaic industry has grown tremendously in the past fifty years – from 2006 to 2014 alone, it grew by 40x – and is expected to continue. Humanity’s understanding of photovoltaic materials and their physics has increased exponentially, leading to far more efficient materials and solar cell architectures.
Knowing how intimately solar simulators are linked to photovoltaics research, it should then come as no surprise that, with our newfound understanding and expansion of photovoltaic capabilities, come new requirements for how to better test them. The advances in photovoltaic technology are part of the reason for the updated requirements in IEC 60904-9.
Photovoltaic Developments Driving the IEC 60904-9:2020 Changes
Any photovoltaic device’s goal is to convert sunlight into electricity. The more efficiently a device can do that, the better it is. Researchers are always searching for higher efficiencies.
Often, increased efficiency can be gained by absorbing more of the sun’s spectral range. Silicon (Si), the dominant material used in most solar cells, usually only absorbs light from 400 nm to 1100 nm, which is one reason why the solar simulator standards only specified light in that range for AM1.5G.
Now, however, more research has been done on tandem, multi-junction, and other compound materials, such as perovskite-Si solar cells, which extend the range beyond the standard 400 nm to 1100 nm. Researchers are now able to capture much more of the solar spectrum, implying increased efficiencies and, therefore, energy capture that will play a major role in meeting humanity’s current and future energy needs.
The challenge, however, is that researchers have to quantify their devices’ improved performances under laboratory conditions using solar simulators. If they have a solar cell that can now efficiently capture infrared light out to 1200 nm, they won’t be able to reliably demonstrate and measure those gains with a solar simulator that is only classified from 400 nm to 1100 nm.
Therefore, as researchers expand the range of the light they can capture from the sun, the solar simulators have to be able to produce those same ranges of the spectrum.
This update to IEC60904 ensures solar simulator measurements are accurate and reflective of real-world conditions, while still having the benefit of a controlled system that can be turned on reliably and consistently (unlike the alternative of doing outdoor testing).
The Development of High-Powered LEDs
When the draft ASTM E927 standard was written for solar simulators in 1979, the only lamps capable of coming close to sunlight reproduction were gas discharge lamps – specifically, xenon-arc and metal-halide bulbs. These bulbs generally have broad spectral emission because they create a plasma similar to the blackbody emitter, which is our sun. Some of the bulbs’ stronger emission lines from energized atoms are still present and need to be filtered out, but on the whole these bulbs have broadband emission.
Therefore, if you used a gas discharge lamp to match the overall intensity for a wide spectral bin (100 nm to 200 nm wide, for example), chances were high that you were not only matching the intensity, but the overall shape of the solar spectrum as well. Therefore, the standards for solar simulators only needed to be written in such a way that the relative intensity in several large bins was specified: 18.4% for the spectral bin from 400 nm to 500 nm, 19.9% for the spectral bin from 500 nm to 600 nm, and so on.
However, the development of high-powered LEDs allowed for the creation of LED-based solar simulators, which have fundamentally different properties and operations from that of gas discharge lamps. LEDs are generally narrow-band. A good rule of thumb, for example, is that an LED’s bandwidth is 10-20% of its peak position in nm – so a 400 nm LED will have a 40 nm bandwidth, while a 1000 nm LED will have a 100 nm bandwidth, and so on. While some of these LEDs are broader than others, few individual LEDs come even close to the 1000s of nm wavelength breadth covered by gas discharge lamps.
This means that many LEDs must be combined to produce a solar simulator.
With this new approach to building solar simulators come new ways to meet the letter of the standard without necessarily meeting the spirit. This is important because a Class AAA solar simulator can have such a distorted spectrum that any test results they produce do not strongly correspond to a device or material’s behaviour under actual sunlight. Class A spectral match, for a layperson, implies a certain fidelity and trustworthiness that can, in fact, be absent. A solar simulator with a distorted spectrum that meets the definition of Class A spectral match might lead to false conclusions about device characteristics, which is detrimental to good research and progress.
Let’s take, for example, the 400 nm – 500 nm spectral range. If you need 18.4% of my spectral intensity to be in this range to meet Class A spectral match requirements, there’s no restriction on where this 18.4% has to lie within the range. You can buy a strong blue LED that produces light from roughly 400 nm to 440 nm. As long as your LED is bright enough to produce 18.4% of the intensity of the AM1.5G spectrum, you can meet the standards for Class A spectral match without producing any light from 440 nm to 500 nm.
These kinds of massive spectral holes simply weren’t possible with gas discharge lamps. If the intensity had dropped in a portion of a bin, it dropped in the entire bin, meaning that the lamp would no longer meet the standard for a high-quality solar simulator. These spectral holes can be exploited as loopholes in the Class A standard, and end users must be aware.
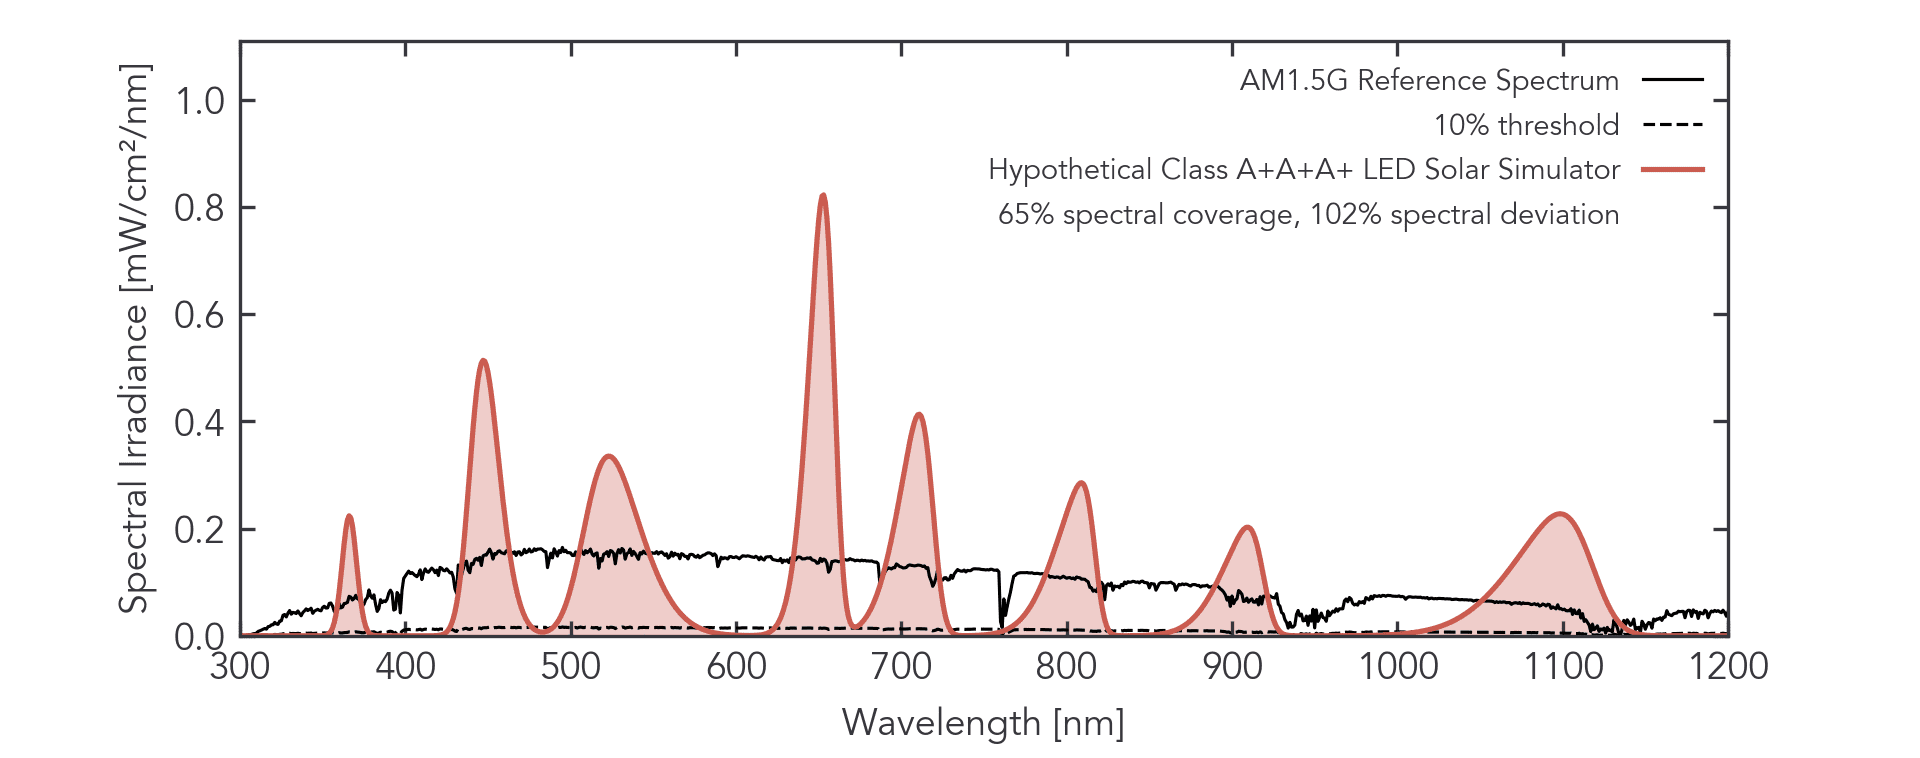
Now that LEDs can produce similar intensities, a spectrum that looks like spread-apart “fingers” could still be considered a Class A (or even A+) spectral match (see below for an example of such a hypothetical spectrum that still meets Class A+ requirements).
Therefore, to help users understand the performance of LED solar simulators and to encourage the production of solar simulators that meet the spirit of true sunlight reproduction, the IEC has added a few additional metrics that can be used to evaluate and communicate the performance of solar simulators – specifically, LED solar simulators.
These two new metrics are spectral coverage and spectral deviation, which we’ll discuss below.
What does the IEC 60904-9 Class A+ Standard mean?
One of the biggest changes in the new IEC 60904-9 standard is the introduction of the Class A+ classification, which raises the bar for the highest quality classification achievable by a solar simulator. Just as there have been many advances in photovoltaic technology in the past several decades, solar simulators have also gotten much better at producing spectra that mimic that of the sun. The new Class A+ standard reflects the improvements made in solar simulator technology as a whole.
For all three original standard metrics by which solar simulators are measured – spectral match, spatial non-uniformity, and temporal instability – Class A+ is twice as good as Class A.
Below is a summary table reproduced from the standard. The practical meaning is that a Class A+ produces a more accurate spectrum, has a flatter illumination field, and exhibits less noise variation.
| Classification | Minimum Wavelength Range to be Evaluated (nm) | Spectral match to all spectral bins (%) | Spatial non-uniformity (%) |
Temporal instability | |
| Short-term instability (STI) % |
Long term instability (LTI) % |
||||
| A+ | 300-1200 | 87.5 to 112.5 | 1 | 0.25 | 1 |
| A | 400-1100 | 75 to 125 | 2 | 0.5 | 2 |
| B | 400-1100 | 60 to 140 | 5 | 2 | 5 |
| C | 400-1100 | 40 to 200 | 10 | 10 | 10 |
What criteria have to be reported for Class A+?
There’s an additional caveat on the Class A+ classification, which reflects the need to meet the expanding needs of photovoltaic researchers (discussed above). For a solar simulator to qualify for the Class A+ designation in any of the 3 metrics, the solar simulator must be evaluated across the extended range of 300 nm to 1200 nm (and its spectral match evaluated accordingly).
This new wavelength range has different bin divisions from the original 400 nm to 1100 nm standard, which are given in the tables below for comparison (consolidated from the standard). You’ll notice that the new bin divisions are done in such a way that the percentage of the total irradiance in each spectral bin is about the same—i.e., each bin covers roughly the same fraction of the total spectral irradiance.
| Spectral Irradiance Distribution in the restricted 400 nm to 1100 nm range. | Spectral Irradiance Distribution in the extended 300 nm to 1200 nm range. | ||||
| Spectral Bin number | Wavelength range (nm) | Percentage of total irradiance (%) | Spectral Bin number | Wavelength range (nm) | Percentage of total irradiance (%) |
| 1 | 400 – 500 | 18.4 | 1 | 300 – 470 | 16.61 |
| 2 | 500 – 600 | 19.9 | 2 | 470 – 561 | 16.74 |
| 3 | 600 – 700 | 18.4 | 3 | 561 – 657 | 16.67 |
| 4 | 700 – 800 | 14.9 | 4 | 657 – 772 | 16.63 |
| 5 | 800 – 900 | 12.5 | 5 | 772 – 919 | 16.66 |
| 6 | 900 – 1100 | 15.9 | 6 | 919 – 1200 | 16.69 |
This new classification is, in some ways, long overdue to differentiate passable from exceptional solar simulators – a distinction that wasn’t possible until more recent progress and developments in the field. This new classification will inevitably result in more accurate and meaningful tests by photovoltaic researchers, which will, in turn, have a positive impact on the world’s renewable energy sources.
The Class A+ designation is the major change in IEC 60904-9 with stringent requirements. The remainder of the changes provide optional reporting metrics that will nevertheless impact the lingua franca of solar simulators.
The CLASS A+ designation is the major change in IEC 60904-9:2020 that has stringent requirements.
What is Spectral Coverage?
The first of the two new metrics IEC 60904-9 introduced is spectral coverage (abbreviated as the acronym SPC in the standard). This quantity is the percentage of the spectrum between 300 nm and 1200 nm covered by a solar simulator’s output.
What does it mean for a spectral region, or bandwidth, to be considered “covered”?
IEC 60904-9 considers a bandwidth to be “covered” by a solar simulator if the spectral irradiance is larger than 10% of the AM1.5G reference irradiance at that same wavelength. This standard therefore excludes the broad-but-often-weak tail edges of some LED emissions, and instead focuses on the key regions where meaningful irradiance can be measured.
Let’s consider the example of the 400 – 500 nm spectral range again.
The Class A spectral match places no restriction on where the target 18.4% irradiance has to lie within the range, so we hypothetically take a very strong blue LED, which only produces light in a fraction of the spectral range. According to the standards, we still have Class A spectral match in this region. However, the spectral coverage gives us more information.
The figure below shows the 10% cutoff point for whether or not a solar simulator covers the spectrum at a given wavelength.
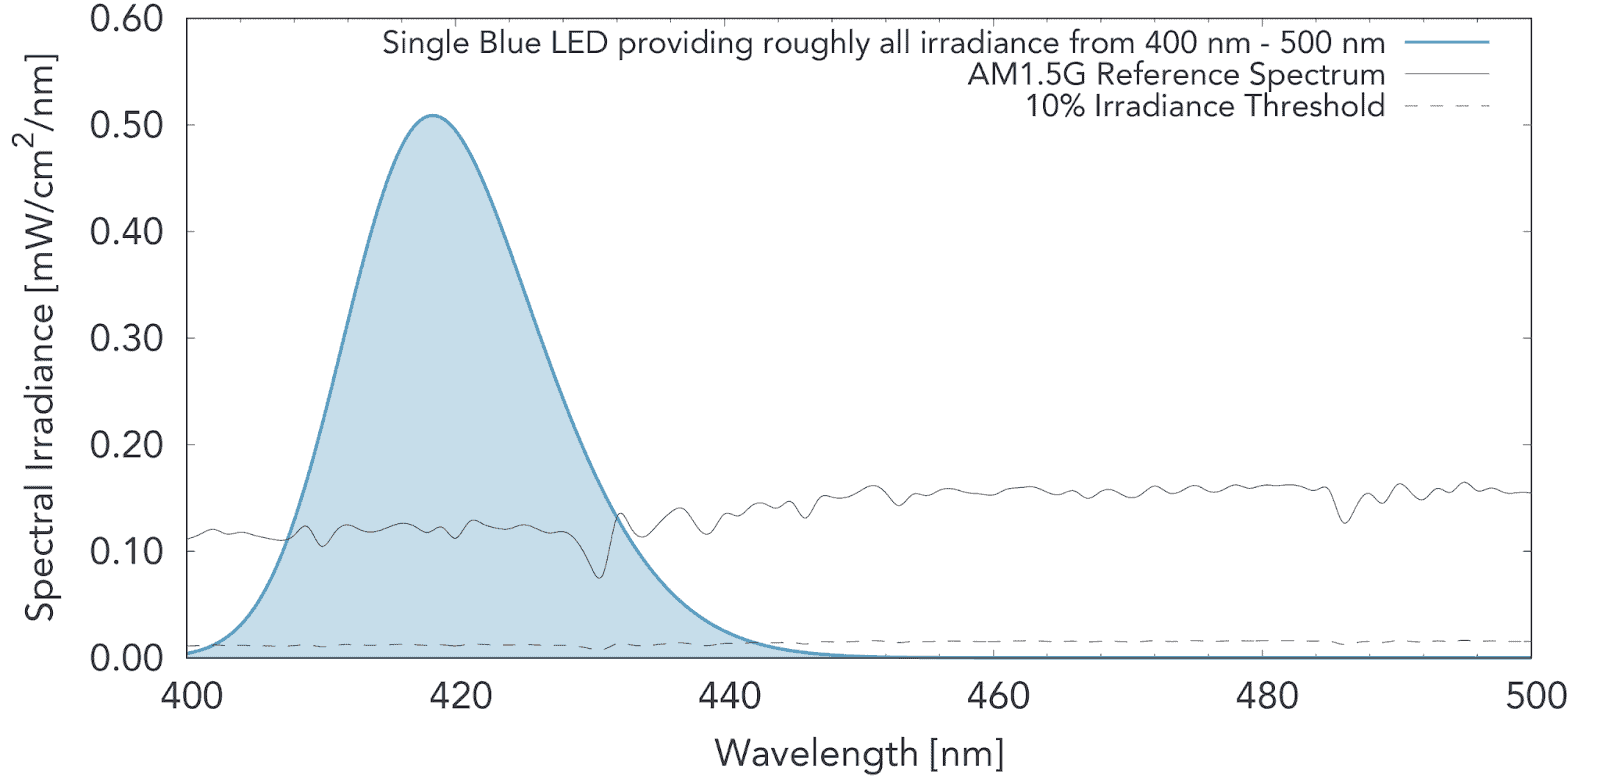
Since our example LED only produces light above the 10% cutoff limit in 40 nm out of the full 100 nm, we would say it has 40% spectral coverage in that region. By applying the same principles over the entire spectrum, the spectral coverage parameter provides additional information not captured by the Class A spectral match metric.
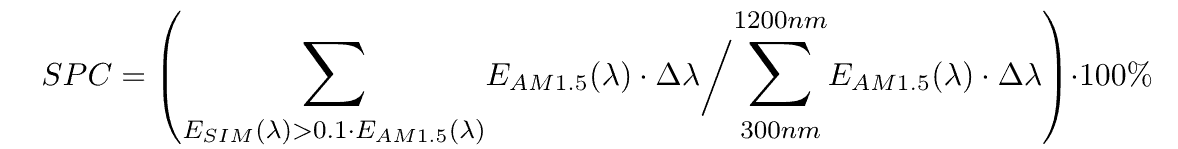
Mathematically, calculating the percentage of spectral coverage is to sum regions where a solar simulator produces irradiance above 10% of the AM1.5G reference spectrum and divide that by the total irradiance from 300 m to 1200 nm. This is given in Equation 3.12 (3) from IEC 60904-9:2020, shown here.
Why is Spectral Coverage Necessary?
As mentioned above, when high-power LEDs improved to the point that they could be used for solar simulation, it became possible for solar simulators to be built that meet the letter of the standard for Class A solar simulators without meeting the spirit. That is, it was possible to achieve the spectral match of an entire spectral bin by overpowering an LED covering a small spectral range anywhere within the bin.
In the example given above, we could cover the 400 nm to 500 nm range with a really strong blue LED emitting from 405 nm to 445 nm, while having no light in the range of 445 nm to 500 nm. This situation can hardly be considered to be doing solar simulation, and this is where the spectral coverage parameter comes in.
For this example, even if the solar simulator achieves Class A (or even A+) spectral match by producing the right irradiance from 400 nm to 500 nm, it would have poor spectral coverage.
To further emphasize the extra information, and the ways that the Class A/A+ standard without spectral coverage can be manipulated without meeting the intention of true reproduction of the solar spectrum, it’s worth looking at an example.
In the most extreme case, a single LED can be selected for each spectral region, and its output can be increased until the total irradiance in that bin matches the target.
Let’s dig deeper into the “finger-like” spectrum from before.
Visually, it doesn’t look very close to the solar spectrum, does it?
Yet, by the strict definitions in the standards, such a hypothetical device could be accurately said to have a Class A+ spectral match and sold as such.
Here’s where the spectral coverage gives us additional information. Although the above graph achieves Class A+ spectral match, its spectral coverage from 300 nm to 1200 nm is only 65%. We see that spectral coverage gives users and manufacturers another metric to assess whether a solar simulator is reproducing sunlight with high or low accuracy. A higher spectral coverage is better.
The spectral deviation gives us additional information in the same vein.
Spectral coverage gives both users and manufacturers another metric by which to assess whether a solar simulator is reproducing sunlight with high or low accuracy. A HIGHER SPECTRAL COVERAGE IS BETTER.
What is Spectral Deviation in the IEC 60904-9:2020?
Spectral deviation, or SPD, can be qualitatively understood as representing the total extent to which a solar simulator goes above or below the specified spectrum. This is defined mathematically as the sum of all the errors over the spectrum – that is, how far the irradiance at a given wavelength is from the target reference spectrum of AM1.5G.
One calculates spectral deviation by summing up the absolute differences in irradiance at all wavelengths, multiplying by the optical bandwidth, and dividing by the total integral of the spectrum, given by Equation 3.13 (4) of the IEC 60904-9:2020 standard, shown here:
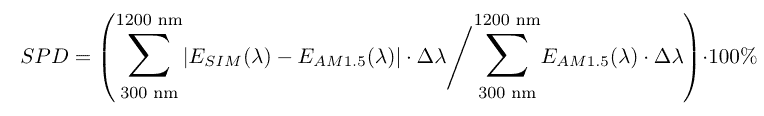
This is a mathematical way of computing how close the peaks and troughs of the spectrum line up to the AM1.5G reference standard.
A lower spectral deviation is better, because it means that the total error is low.
If we look at the example of a hypothetical Class A+ LED solar simulator above, we can see that the peaks and troughs go quite far above and below the standard reference spectrum. Its spectral deviation is, not surprisingly, 102%. (An important note – it is possible to have an error much higher than 100% under the definition of spectral deviation, though only a few commercial solar simulators approach these high spectral deviation levels)
The IEC 60904-9 standard thus gives us more metrics by which we can talk about solar simulators.
Not all Class A spectra are created equal, and the new language of spectral coverage and spectral deviation provides appropriate standards against which to compare solar simulators.
The hypothetical LED solar simulator indeed has Class A+ spectral match, but now we can also report that it has 65% spectral coverage and 102% spectral deviation – both of which are very poor. Anyone considering using such a solar simulator for their work can now, at a glance, see representative numbers for the solar simulator’s overall quality.
For some limited applications, such a high spectral deviation and low spectral coverage might not matter to a researcher’s end results. A researcher might, for example, be able to correct the spectral mismatch by modelling or translating the physics to its equivalent impact on the neighbouring region. In other cases, a researcher’s material may only be photoactive across a limited wavelength range, so that a high spectral coverage range adds no value to the experiment. It’s also possible the physical processes don’t have a strong sensitivity to the spectral characteristics.
However, these cases are more often the exception rather than the rule, and a high spectral mismatch places a higher burden of proof and analysis on any results or conclusions drawn by researchers using such devices.
Under very specific conditions of well-understood device quantum efficiency, users can potentially get by with an inferior solar simulator, and we’ll discuss those situations and techniques in a future article. However, in the majority of cases, a higher-quality solar simulator is desirable.
Through more meaningful metrics of solar simulator quality, users are more empowered to seek and find a device that aligns with their requirements. This ultimately lessens the additional work, computation and proof necessary to show that researchers’ results are representative of how their material or device will behave under real sunlight.
A LOWER SPECTRAL DEVIATION IS BETTER, because it means that the total error is low.
Comparing Solar Simulators using Spectral Coverage & Spectral Deviation
The hypothetical LED solar simulator was an extreme example of how the standards can, in our opinion, be misused when reproducing sunlight. A more realistic assessment is to consider existing solar simulators on the market and report on their spectral coverage and spectral deviation.
We’ve applied the definition of spectral coverage and deviation over the 400 nm to 1100 nm range for these examples.
We did this because very few solar simulators on the market are built to achieve the 300 nm to 1200 nm range, so assessing them in that range doesn’t seem appropriate or fair. Despite the change in the spectral range, however, we believe the same principles we’ve discussed in this article still apply – it is possible to have a Class A spectral match in the 400 nm to 1100 nm range while having poor spectral coverage and spectral deviation.
Let’s see how some of the existing solar simulators compare in the 400 nm to 1100 nm range.
Innovations in Optics 6000B-100 LED Class AAA Solar Simulator
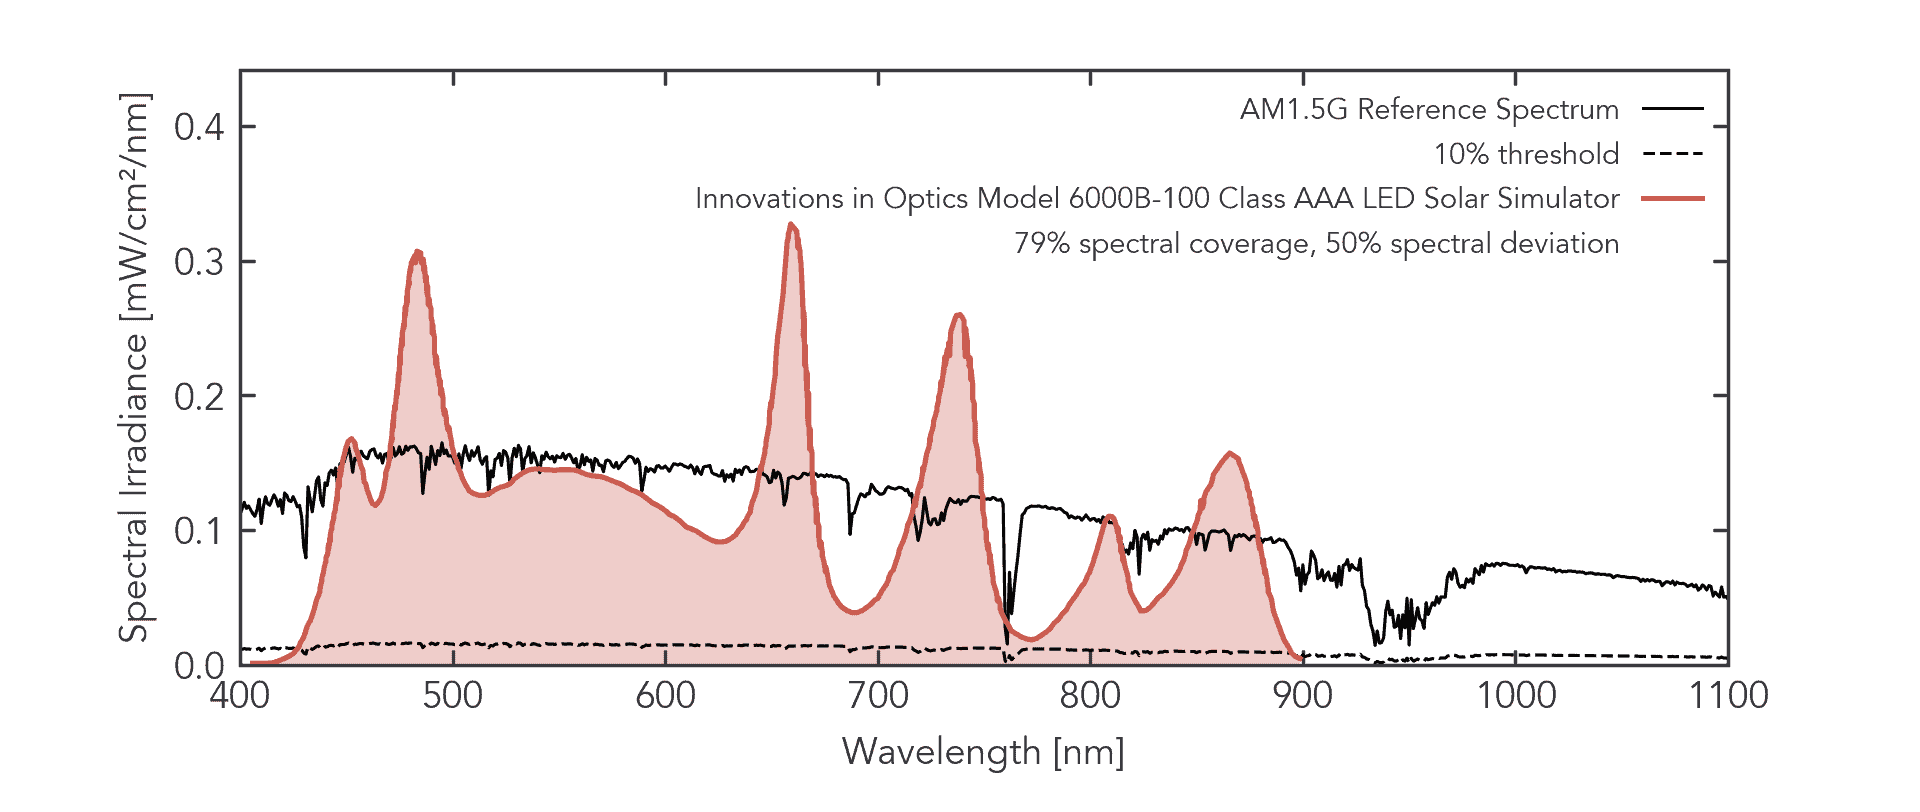
Graph reproduced and then analyzed by digitizing the reported spectrum from IOI’s datasheet retrieved from the web.
Innovations in Optics’ Model 6000B-100 LED Solar Simulator achieves a spectral coverage of 79% and a spectral deviation of 50%.
Note that because irradiation is absent in the 900 nm—1100 nm range, they should not claim to achieve a Class A spectral match (even with the older standards), even if their intended application is for devices whose responsivities do not extend beyond 900 nm.
This solar simulator’s lower spectral coverage is a result of the large gap between 900 nm and 1100 nm, as well as the blue illumination only really starting closer to 450 nm rather than 400 nm. The spectral deviation is high because high-powered LEDs are used to contribute most of the irradiance, leaving large gaps around 700 nm and 780 nm in addition to the regions that are simply uncovered.
Newport Verasol-2 LED Class AAA Solar Simulator
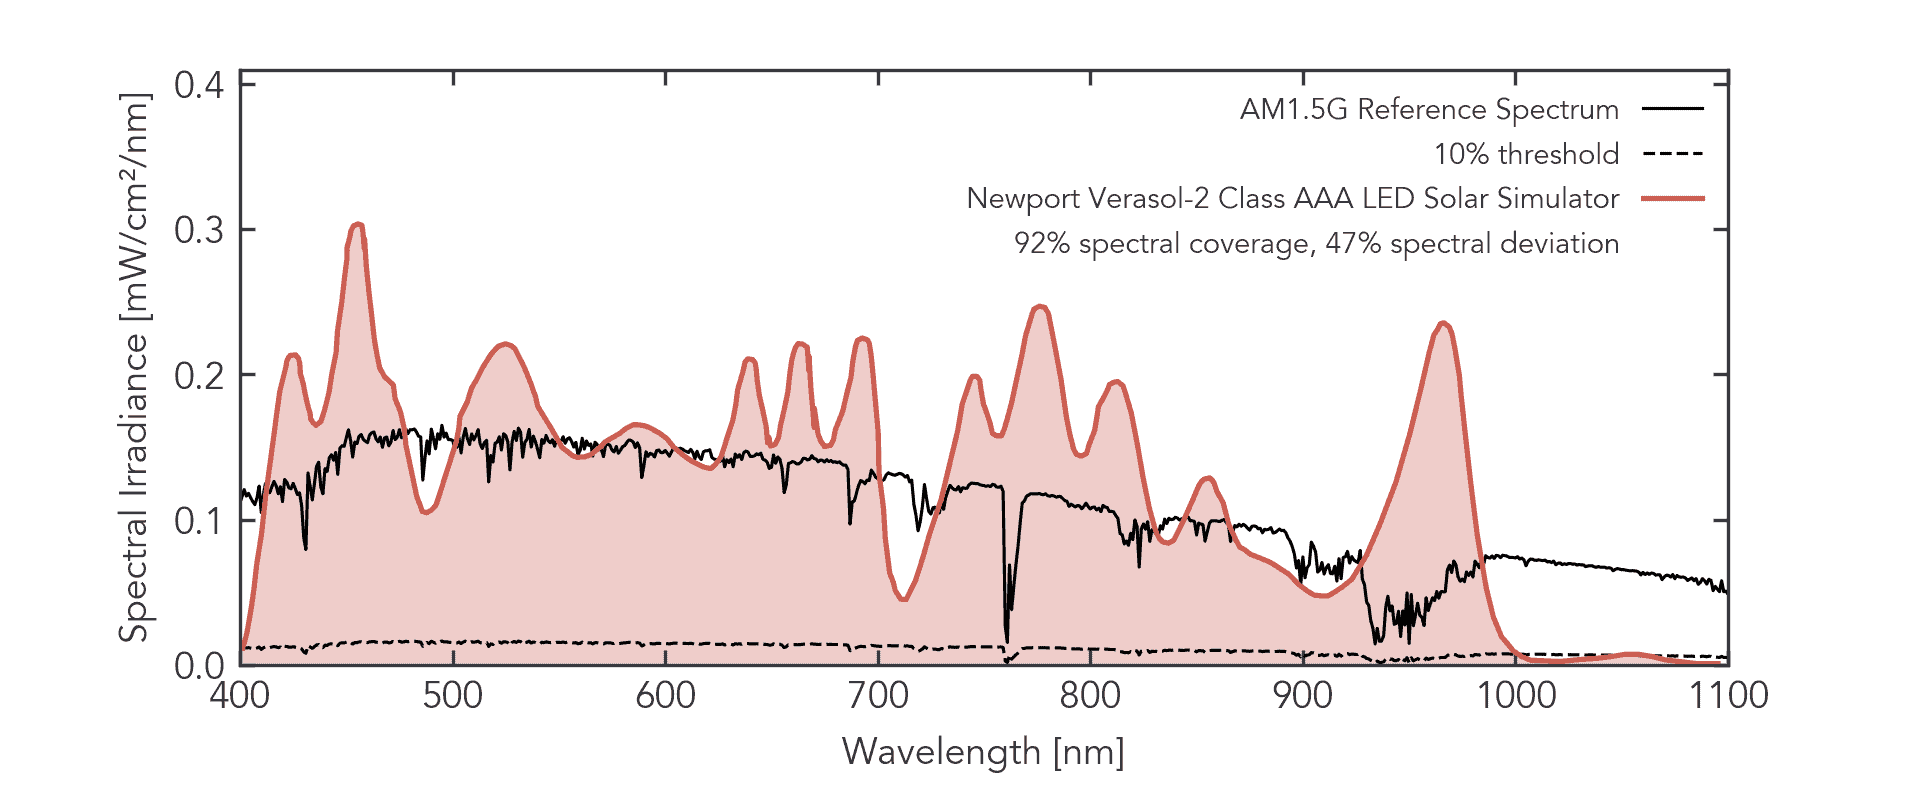
Graph reproduced and then analyzed by digitizing the reported spectrum in the 2016 IEEE Explore paper “Comparison of xenon lamp-based and led-based solar simulators” by Gregory Leary et al.
Newport’s Verasol-2 achieves Class A spectral match with a spectral coverage of 92% and a spectral deviation of 47%.
The lower spectral coverage is a result of the gap between 1000 nm and 1100 nm, and the spectral deviation is high because the ~950 nm LED peak is being used to provide most of the irradiance in the 900 nm to 1100 nm spectral band.
Greatcell Solar Hyperion III LED Class A+A+A+ Solar Simulator
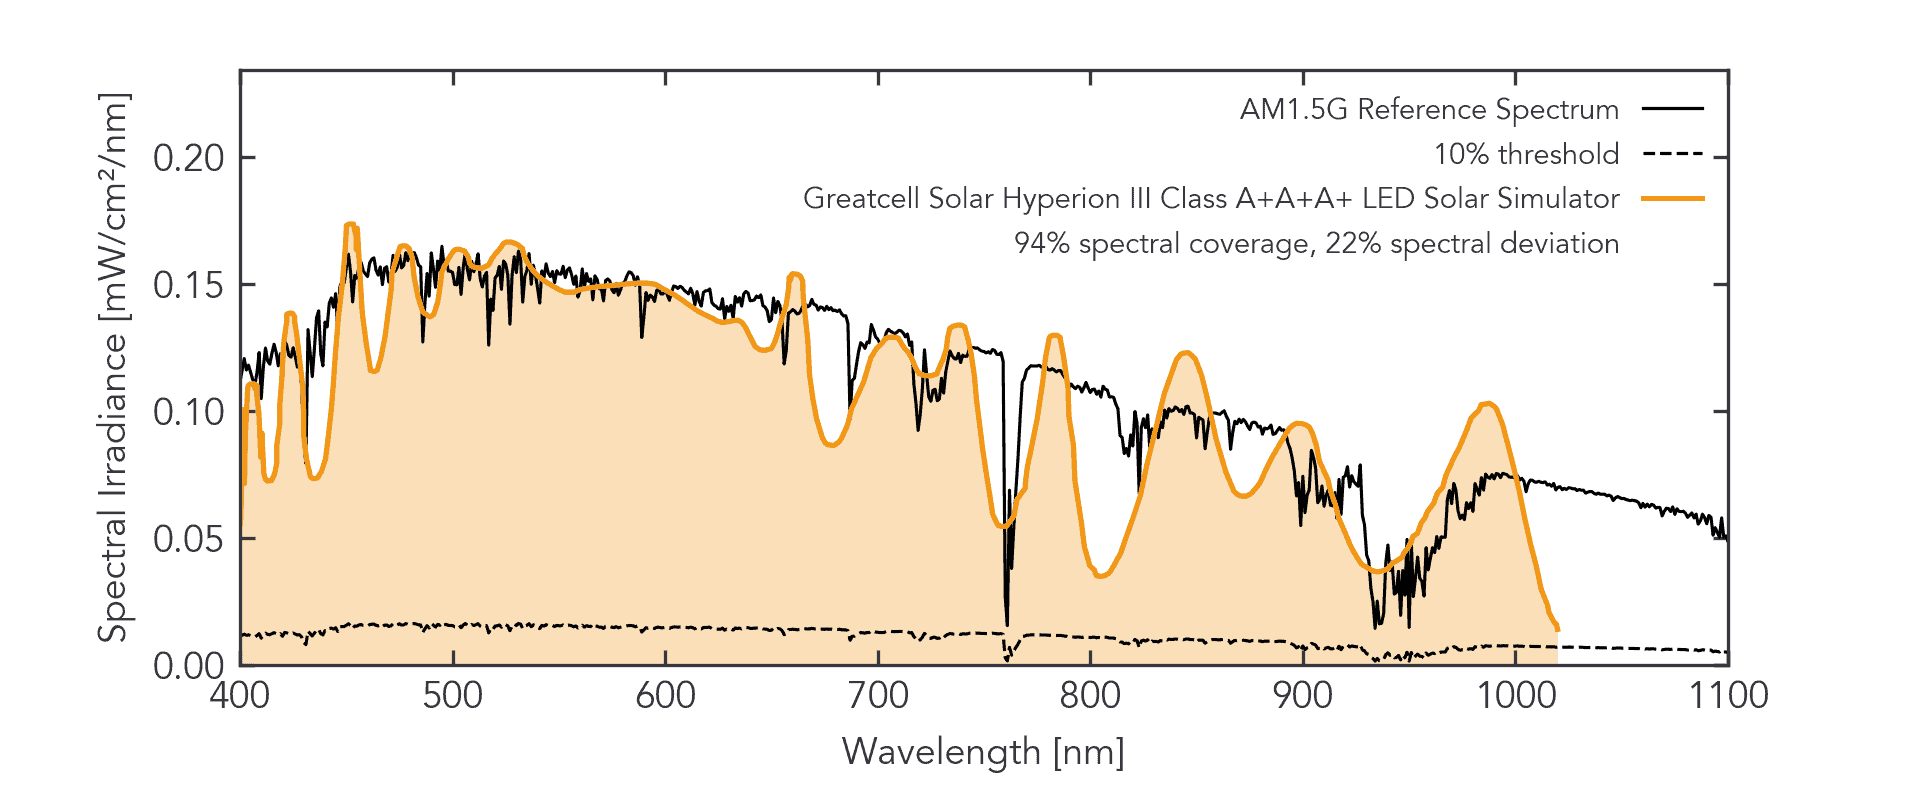
Graph reproduced and then analyzed by digitizing the reported spectrum from Greatcell Solar’s datasheet retrieved from the web.
Greatcell Solar’s Hyperion III LED Solar Simulator achieves a Class A spectral match with a 94% spectral coverage and a 22% spectral deviation.
The lower spectral coverage is a result of the gap between 1000 nm and 1100 nm, and the spectral deviation primarily arises from the uncovered spectrum above 1000 nm, as well as a gap around 800 nm. It’s worth noting that despite not covering the spectrum out to 1200 nm, Greatcell Solar is claiming to be Class A+. We know from the standards that this is not true.
Until the recent IEC 60904-9 2020 update, Class A+ did not exist, and many solar simulator manufacturers attempted to create their own definition of Class A+.
Their solar simulator does not achieve Class A+ spectral match, however, and any claim to be Class A+ should be scrutinized carefully until the IEC 60904-9:2020 is more widely adopted across the industry.
Newport / Oriel Sol 3A Class AAA Xenon Solar Simulator
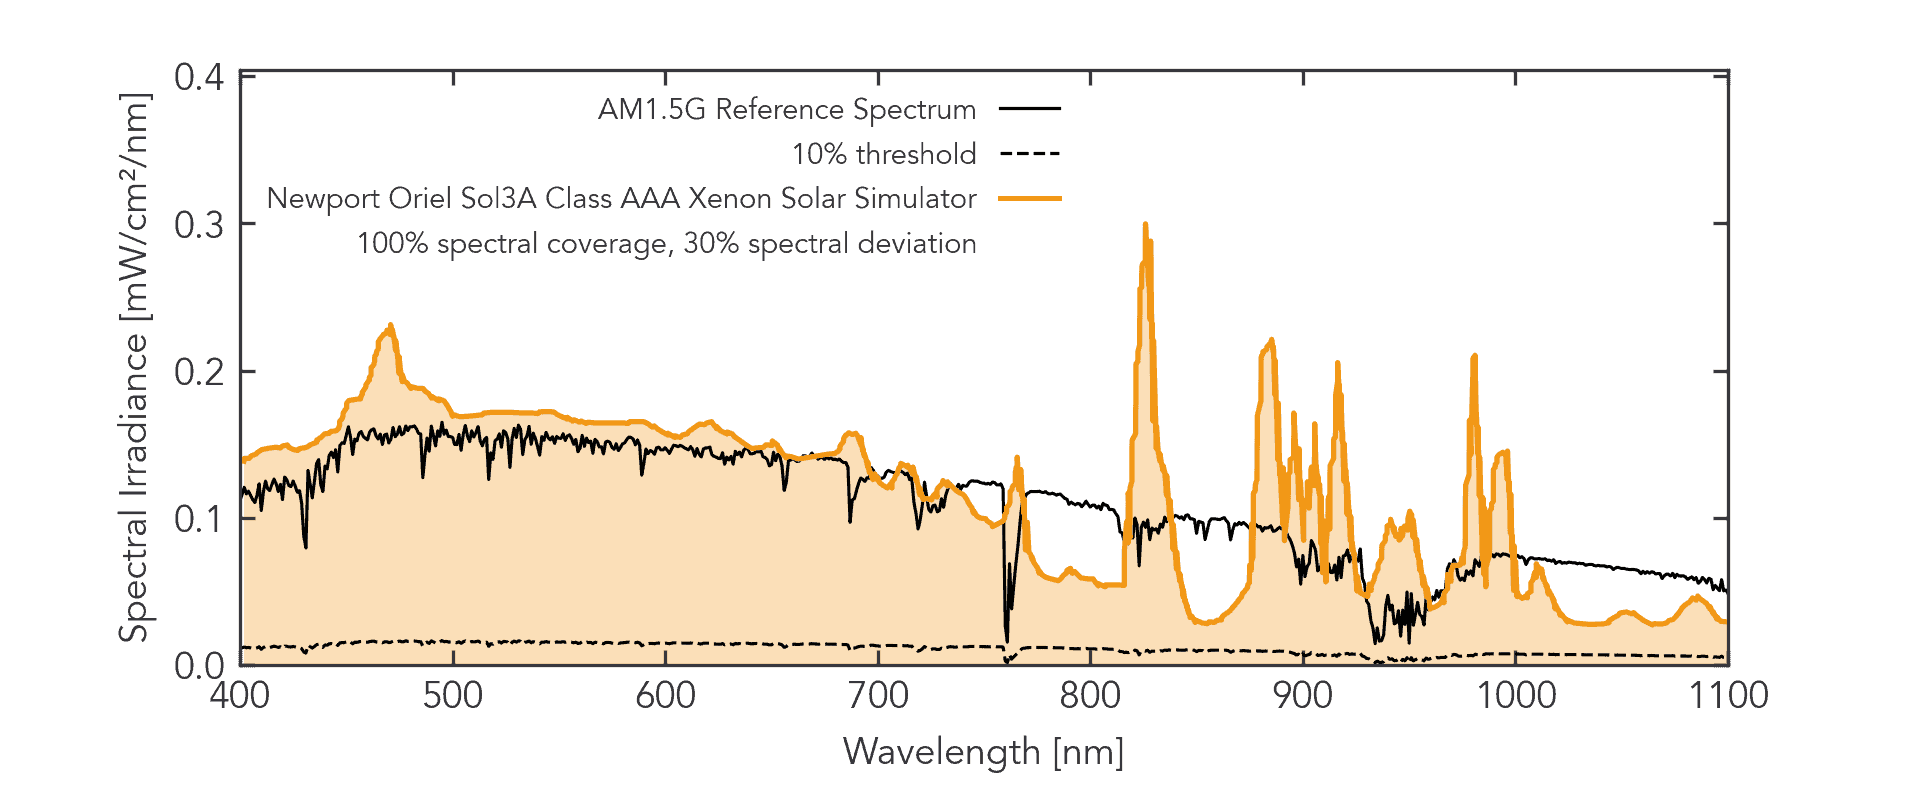
Graph reproduced and then analyzed by digitizing the reported spectrum in the 2016 IEEE Explore paper “Comparison of xenon lamp-based and led-based solar simulators” by Gregory Leary et al.
Newport/Oriel Sol3A achieves Class A spectral match with a spectral coverage of 100% and a spectral deviation of 30%.
Newport/Oriel uses xenon-arc lamps in this solar simulator, which are less prone to some of the issues we’ve discussed regarding LED usage in solar simulators.
However, emission lines inherent to a xenon lamp are quite strong and difficult to filter, so how does this class of solar simulator measure up to the new IEC 60904-9 standard?
Newport/Oriel’s Sol3A Class A spectral match solar simulator achieves 100% spectral coverage because all the spectral irradiance meets the 10% threshold for all points, although we can see visually that there are some gaps that are barely above this threshold in the 750 nm to 875 nm region. These gaps are quantified by a spectral deviation of 30%.
Endeas Quicksun 550CE Class A+A+A+ Xenon-based Module Testing Station
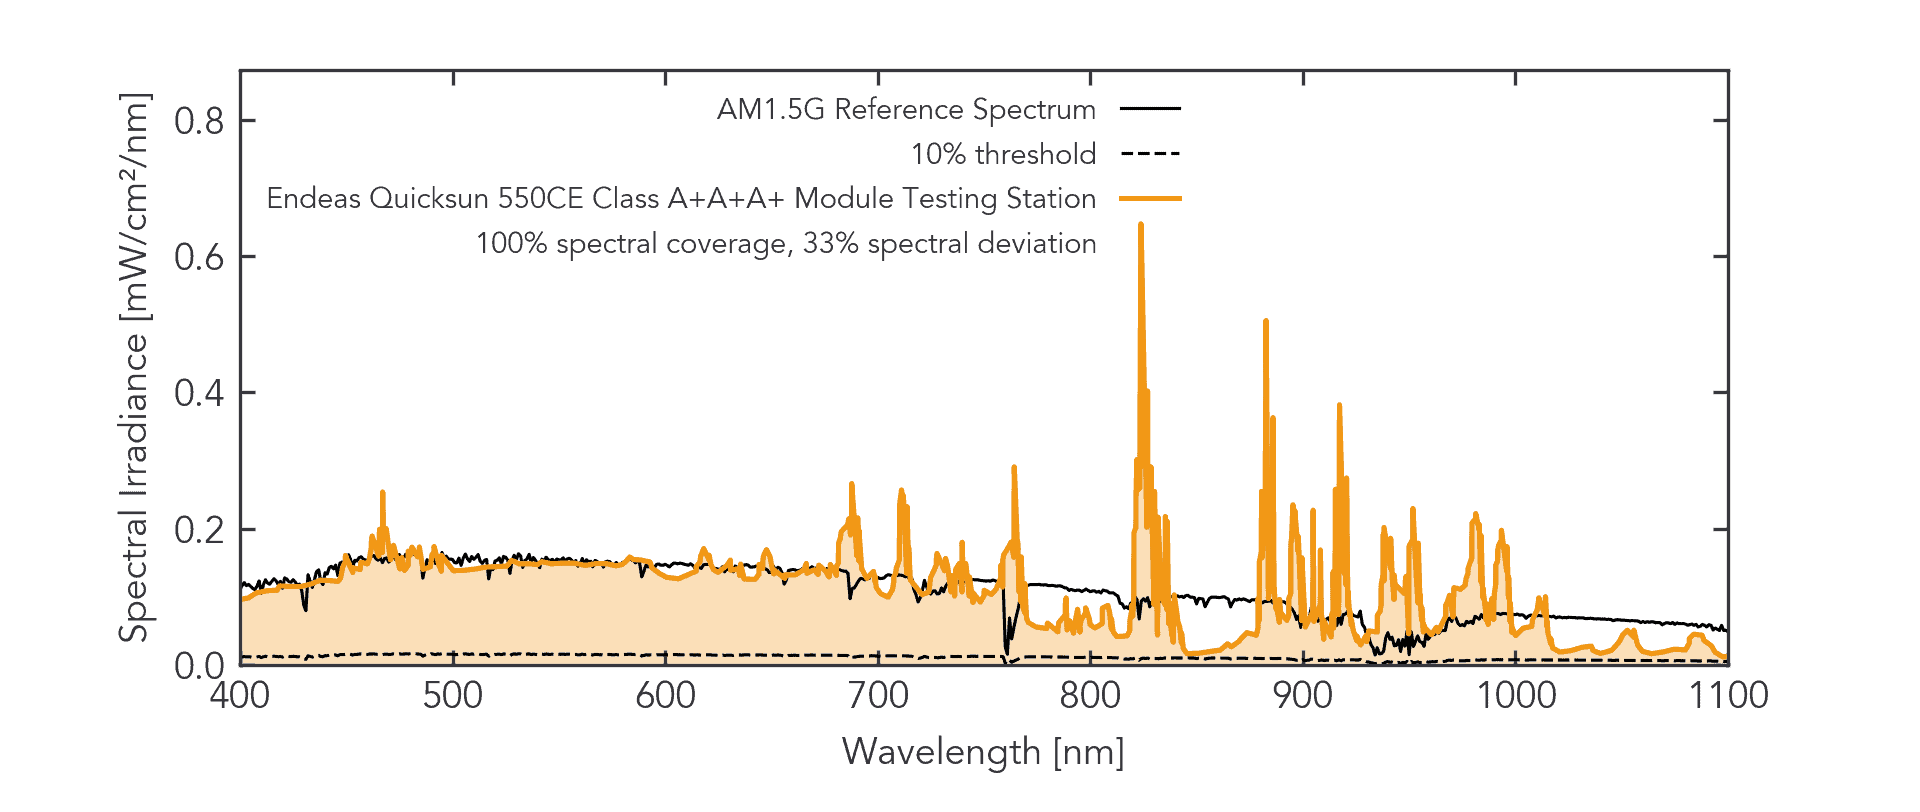
Graph reproduced and then analyzed by digitizing the spectrum from Endeas’ reported spectrum retrieved from the web.
The Endeas Quicksun 550CE achieves Class A+ spectral match with a spectral coverage of 100% and a spectral deviation of 33%.
The Endeas Quicksun 550CE Module Testing Station, which houses a Class A+A+A+ xenon-lamp-based solar simulator, is almost identical to Newport’s Sol3A in terms of spectral coverage and spectral deviation because they are both based on the same fundamental technologies with the same limitations. The sharpness of the peaks compared to Newport could easily be attributed to spectrometer sensitivity or resolution.
Wavelabs SINUS-220 LED Class AAA Solar Simulator
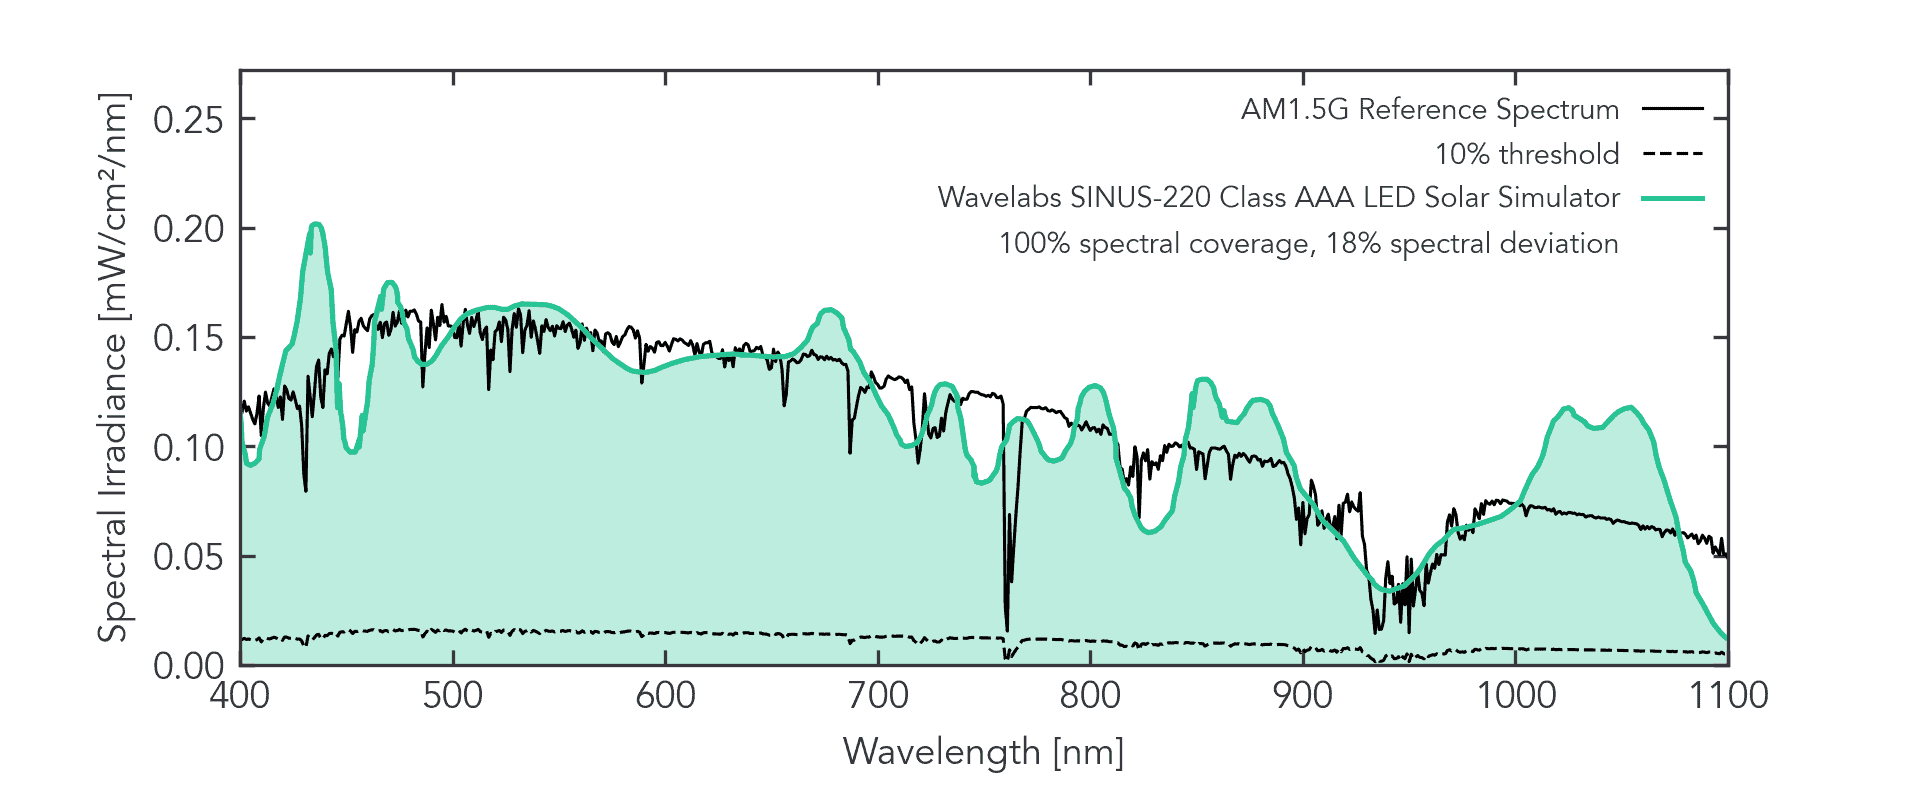
Graph reproduced and then analyzed by digitizing the reported spectrum from Wavelabs’ datasheet retrieved from the web on 2021-06-18.
Wavelabs’ SINUS-220 LED Solar Simulator achieves Class A spectral match with a spectral coverage of 100% and a spectral deviation of 18%.
The spectral deviation primarily arises from the uncovered spectrum near 1100 nm, as well as a few small gaps in the visible to near-infrared. Note that Wavelabs claims Class A++ spectral match and Class A++ long-term temporal instability which are not defined in any of the solar simulator standards.
G2V Optics Sunbrick and Pico Class AAA LED Solar Simulators
G2V strives to produce the most accurate sunlight possible, and the new IEC 60904-9:2020 standard aligns with our philosophy and approach to building solar simulators.
Let’s examine the base Pico (PICO-LMN-DIR) and the base Sunbrick (SBRK-LMN-DIR), which cover the 400 nm to 1100 nm range, and see how they compare to the rest.
G2V Optics Sunbrick SBRK-LMN-DIR Class AAA LED Solar Simulator
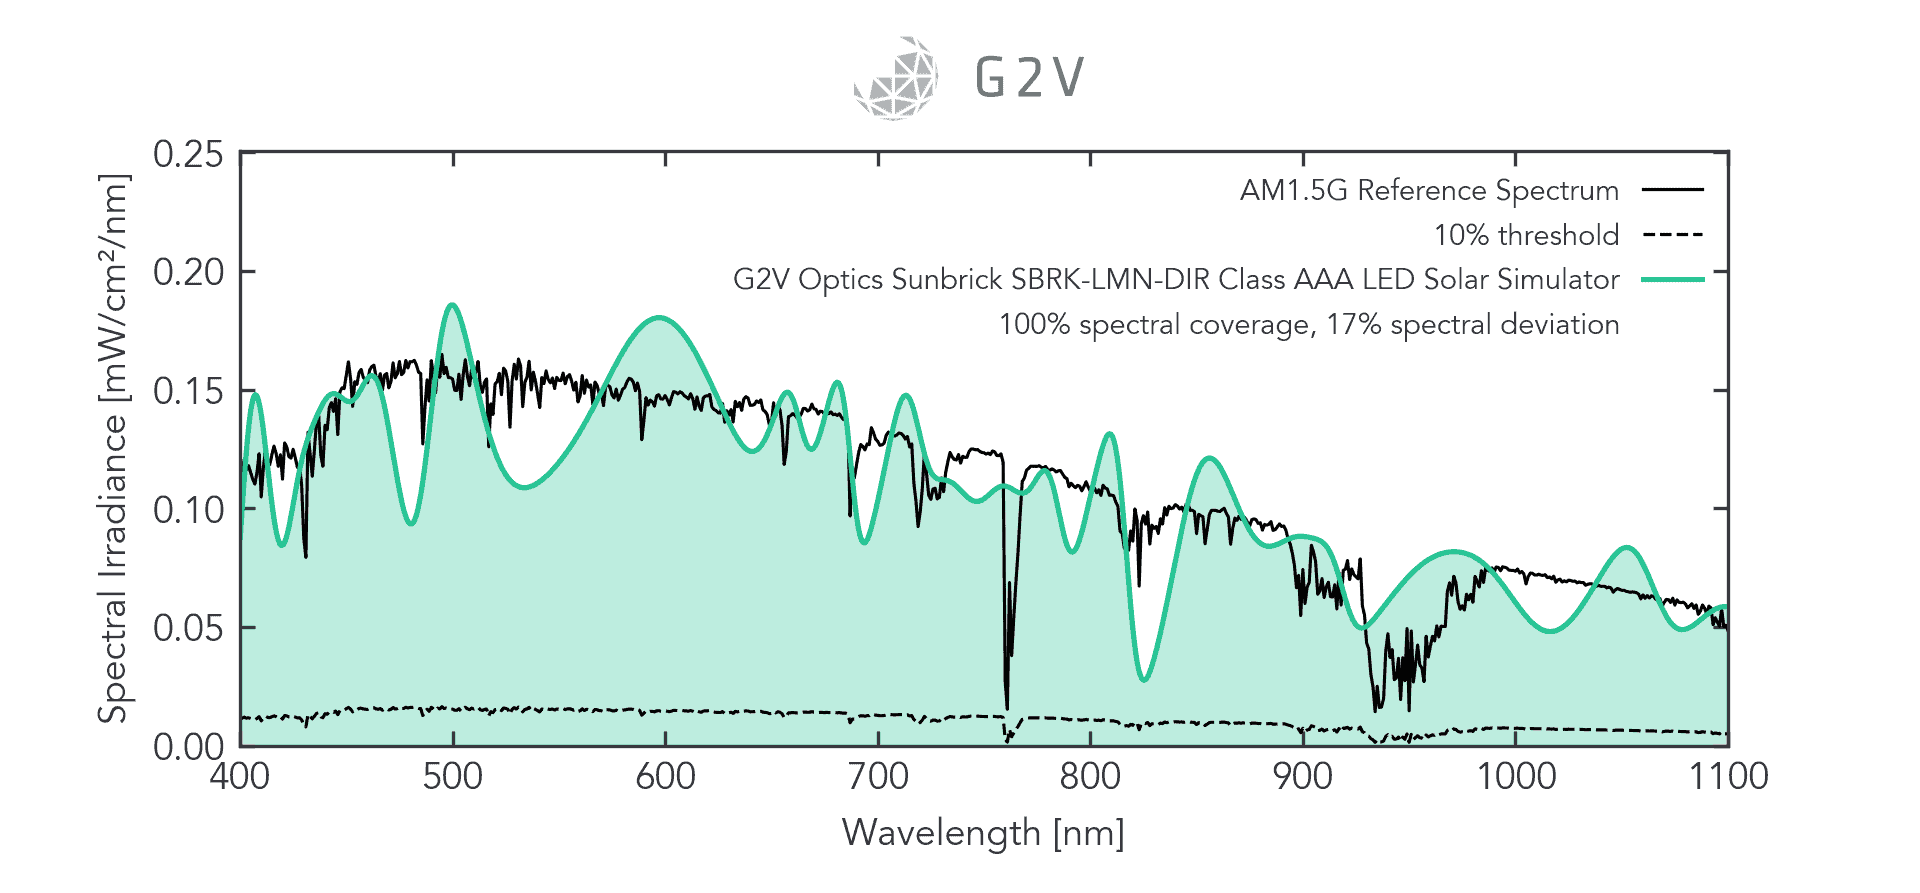
Spectrum of the G2V Optics SBRK-LMN-DIR base Sunbrick solar simulator.
G2V’s Sunbrick achieves Class A spectral match with a spectral coverage of 100% and a spectral deviation of 17%, the best we’ve investigated so far.
The Sunbrick, like the other solar simulators we’ve considered, has Class A spectra match. It achieves a 100% spectral coverage that is obvious from the spectrum, and a slightly better spectral deviation than the Wavelabs SINUS-220: 17%.
G2V Optics Pico PICO-LMN-DIR Class AAA LED Solar Simulator
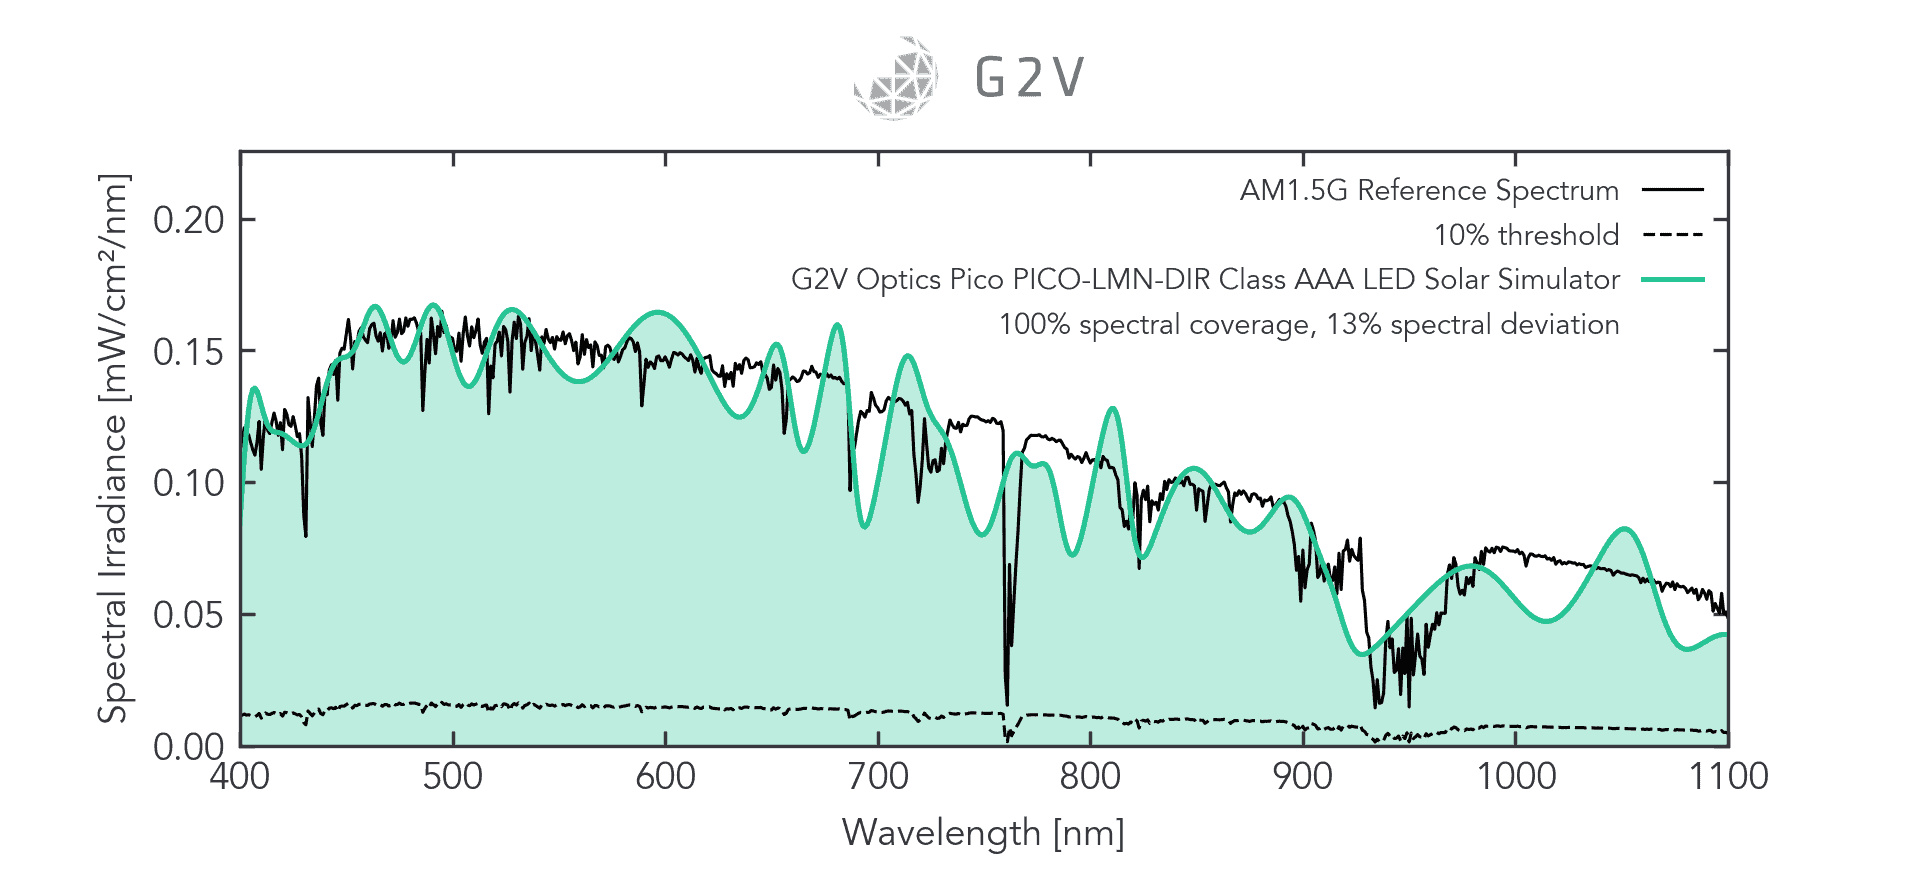
Spectrum of the G2V Optics PICO-LMN-DIR base Pico solar simulator.
G2V’s Pico achieves Class A spectral match with a spectral coverage of 100% and the lowest spectral deviation of 13%.
The Pico also has a Class A spectra match. Its spectrum clearly shows that it achieves 100% spectral coverage while having the lowest spectral deviation of all the simulators we’ve considered above, at 13%.
TL;DR – Quick Summary of the new IEC 60904-9-2020 Standards
- Introduces A+ classification, which is twice as good as Class A in all three metrics of spectral match, spatial non-uniformity, and temporal instability
- Class A+ requires a solar simulator be evaluated in an extended 300 nm – 1200 nm range.
- Two new metrics are introduced: spectral coverage and spectral deviation, which are optional reporting metrics at this time.
- Spectral Coverage (SPC): A higher spectral coverage is better, because it means that output irradiance is produced for a larger portion of the target spectral range.
- Spectral Deviation (SPD): A lower spectral deviation is better, because it means that the output irradiance levels are overall, closer to the irradiance of the AM1.5G or AM0 reference spectra.
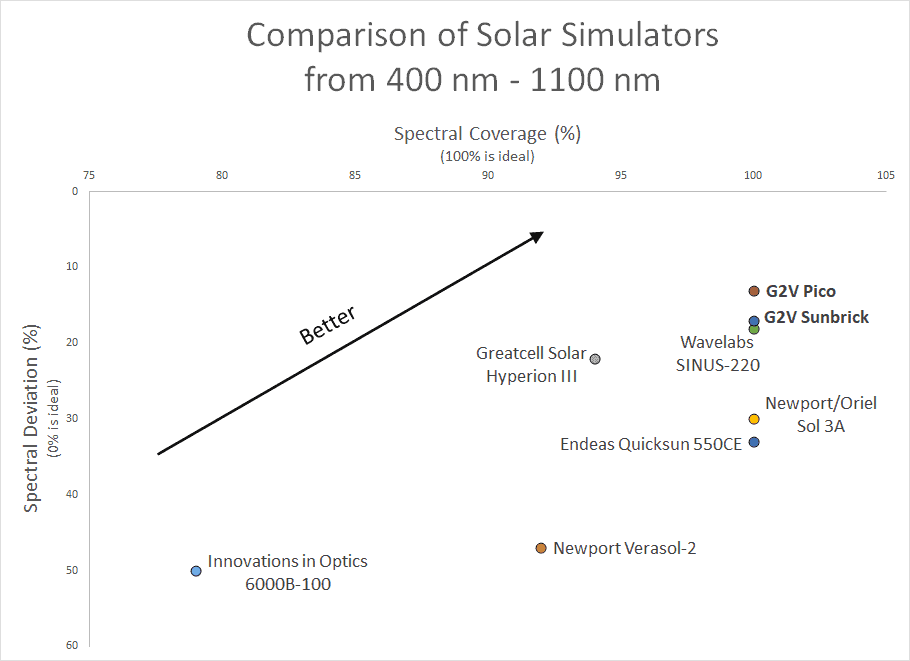
Summary of Solar Simulator Comparison from 400 nm – 1100 nm
These two new metrics of Spectral Coverage and Spectral Deviation provide valuable and necessary tools for comparing and evaluating Class A/A+ solar simulators.
As outlined in this article, not all Class A/A+ spectral match solar simulators are created equal. The two new metrics differentiate reasonable solar simulators from excellent ones, and can be summarized in the following chart comparing Class AAA solar simulators in the 400 nm – 1100 nm range.
As the solar simulator field develops in the coming years, it will be possible to evaluate simulators against the Class A+ requirements in the broader 300 nm – 1200 nm range.
| Manufacturer & Model | Lamp Technology | Spectral Coverage (100% is ideal) |
Spectral Deviation (0% is ideal) |
| Innovations in Optics Model 6000B-100 | LED | 79 | 50 |
| Newport Verasol-2 | LED | 92 | 47 |
| Greatcell Solar Hyperion III | LED | 94 | 22 |
| Newport/Oriel Sol3A | Xenon | 100 | 30 |
| Endeas Quicksun 550CE | Xenon | 100 | 33 |
| Wavelabs SINUS-220 | LED | 100 | 18 |
| G2V Optics Sunbrick SBRK-LMN-DIR | LED | 100 | 17 |
| G2V Optics Pico PICO-LMN-DIR | LED | 100 | 13 |
Better Metrics Toward Better Solar Simulation
While these two new metrics are not required by the new standard, they do provide the framework toward better solar simulation. The theme of moving toward more accurate solar simulation is replete throughout the summarized changes in the new standard:
- Broadening of the spectral region to 300 nm to 1200 nm to enable better testing of wider-band photovoltaic devices
- The definition of Class A+ reflects solar simulator technological advances
- New metrics and language for differentiating accurate from inaccurate spectral reproduction (spectral coverage and spectral deviation).
References
IEC. (2020). 60904-9: Classification of solar simulator characteristics.
Leary, G. et al. (2016). Comparison of xenon lamp-based and led-based solar simulators. IEEE 43rd Photovoltaics Specialists Conference, Portland, Oregon. DOI: 10.1109/PVSC.2016.7750227
NSF/ANSI (2019). NSF/ANSI 51-2019: Food Equipment Materials.
Subcommittee E44.09 (2019). ASTM E927-19: Standard Classification for Solar Simulators for Electrical Performance Testing of Photovoltaic Devices.
University of Alberta Library (2021). What is a Standard? Primer on engineering standards. Retrieved from the web on 2021-06-18.