What is a Solar Simulator’s Spectral Irradiance?
A solar simulator’s irradiance is the light power (in Joules per second, or Watts) that shines on a given area and is usually reported in W/m2 or mW/cm2.
What is Solar Irradiance?
You may have heard that the standard irradiance for sunlight on Earth (the AM1.5G spectrum) is 1000.4 W/m2 (or 100 mW/cm2), while the standard irradiance for extrasolar sunlight (the AM0 spectrum) is 1366 W/m2 (or 136.6 mW/cm2). Check out our solar simulation article if you need a refresher on AM1.5 and AM0 spectrums.
These numbers represent the total integrated irradiance of their respective spectra for wavelengths from 280 nm to 4000 nm. In other words, this irradiance value is the sum of all contributions from a wide range of the sun’s electromagnetic emissions.
Many applications do not depend on the full 280 nm to 4000 nm range.
Monocrystalline silicon solar cells, commonly found in the photovoltaics field, only respond in the approximate 400 nm to 1100 nm range. The rest of the spectrum outside this range might contribute to heating (for wavelengths above 1100 nm) or to material degradation (for wavelengths below 400 nm). However, the results of researchers studying the current-voltage performance of a silicon solar cell do not depend on the total irradiance of the standard spectra.
Spectral Irradiance of the AM1.5G Spectrum
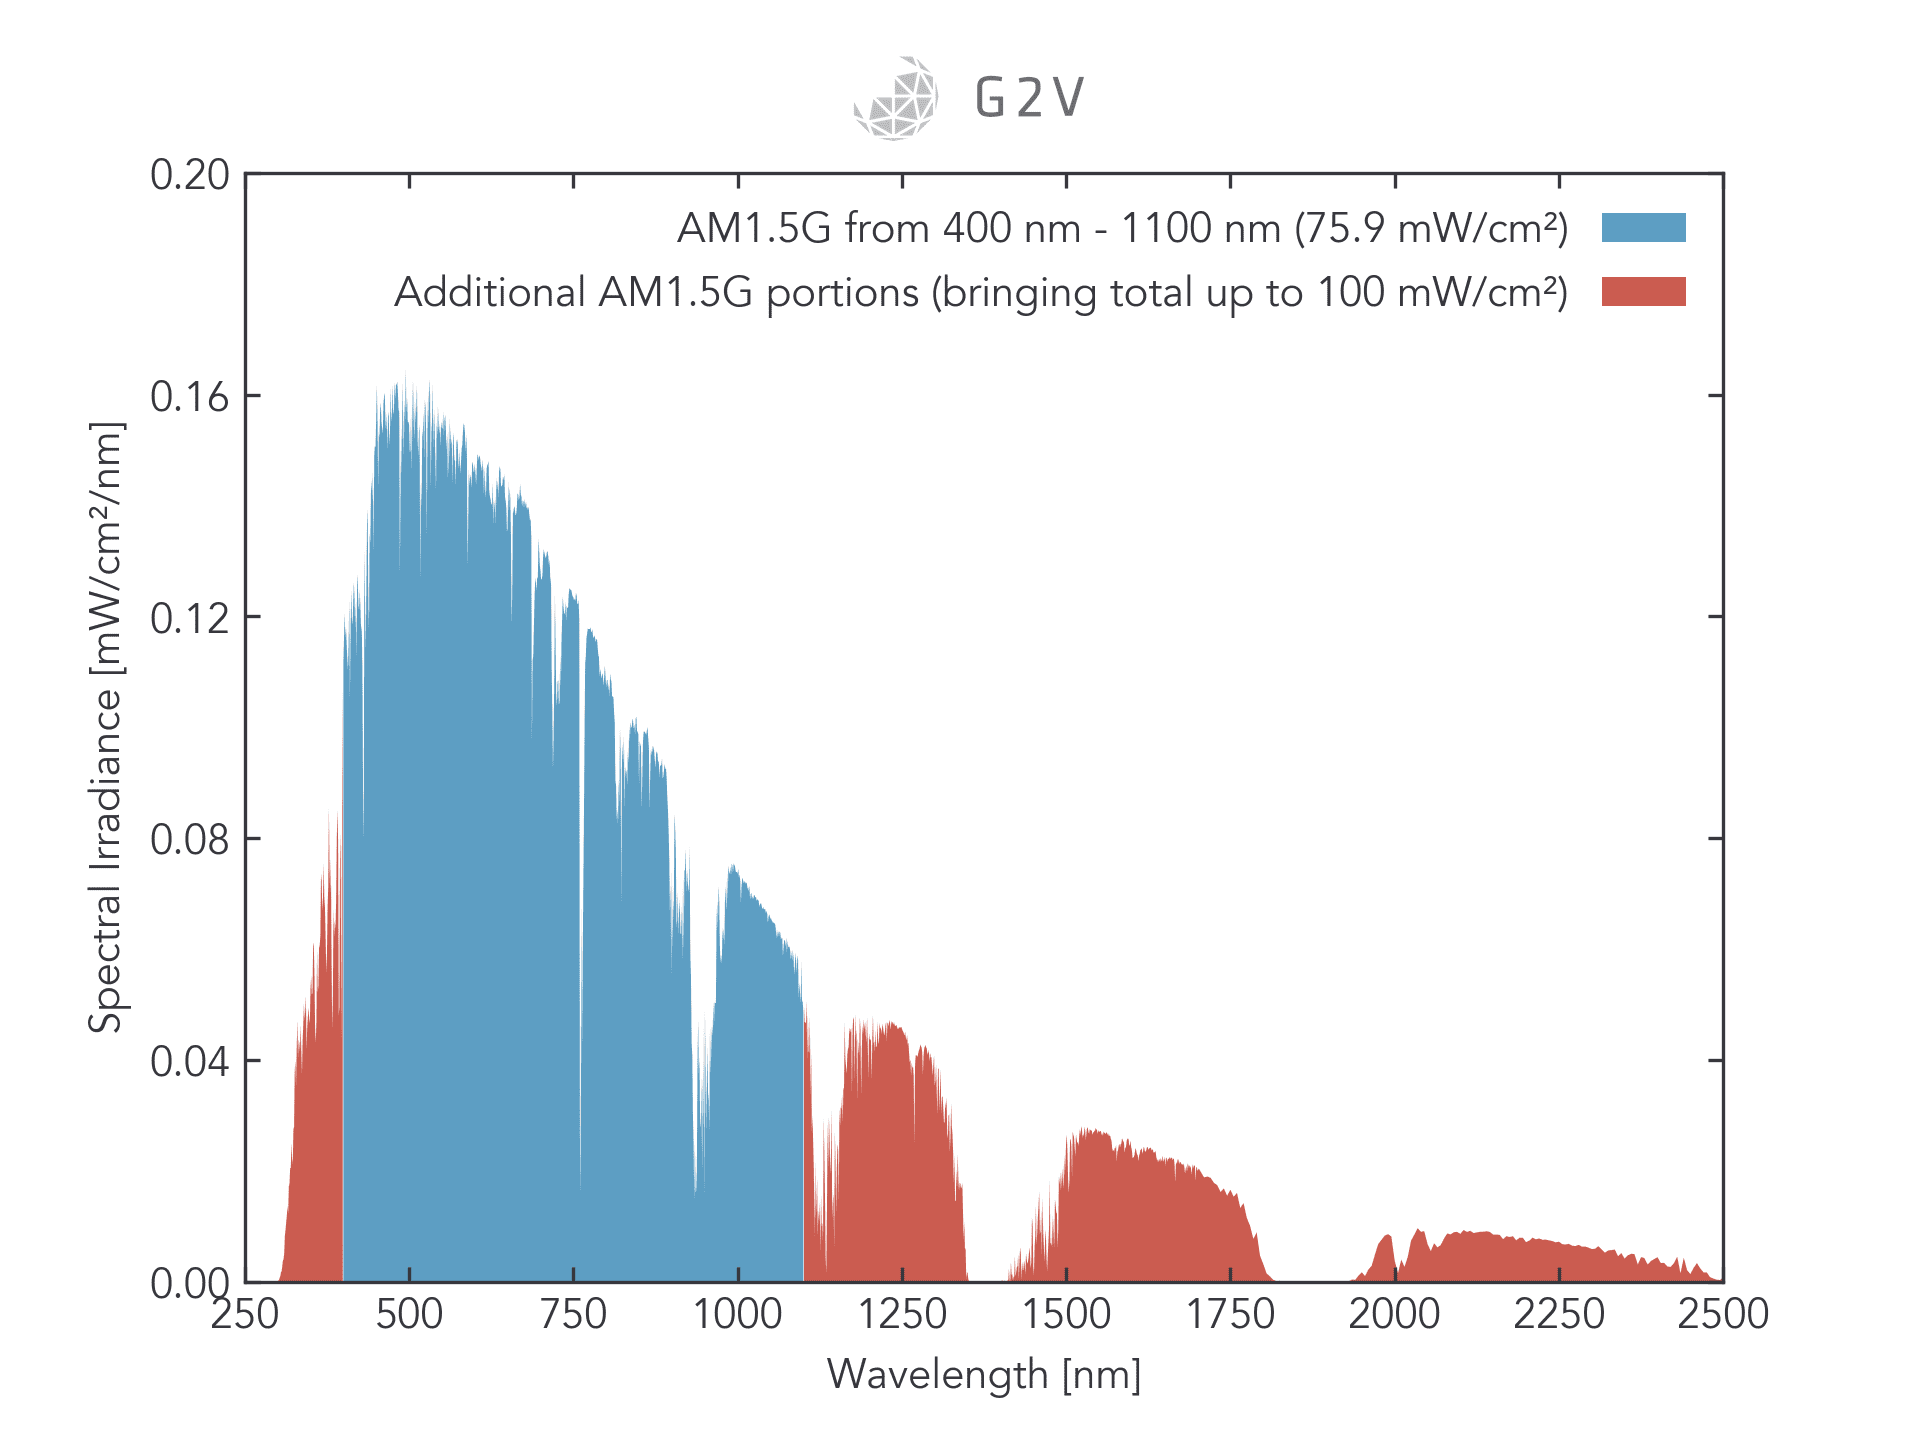
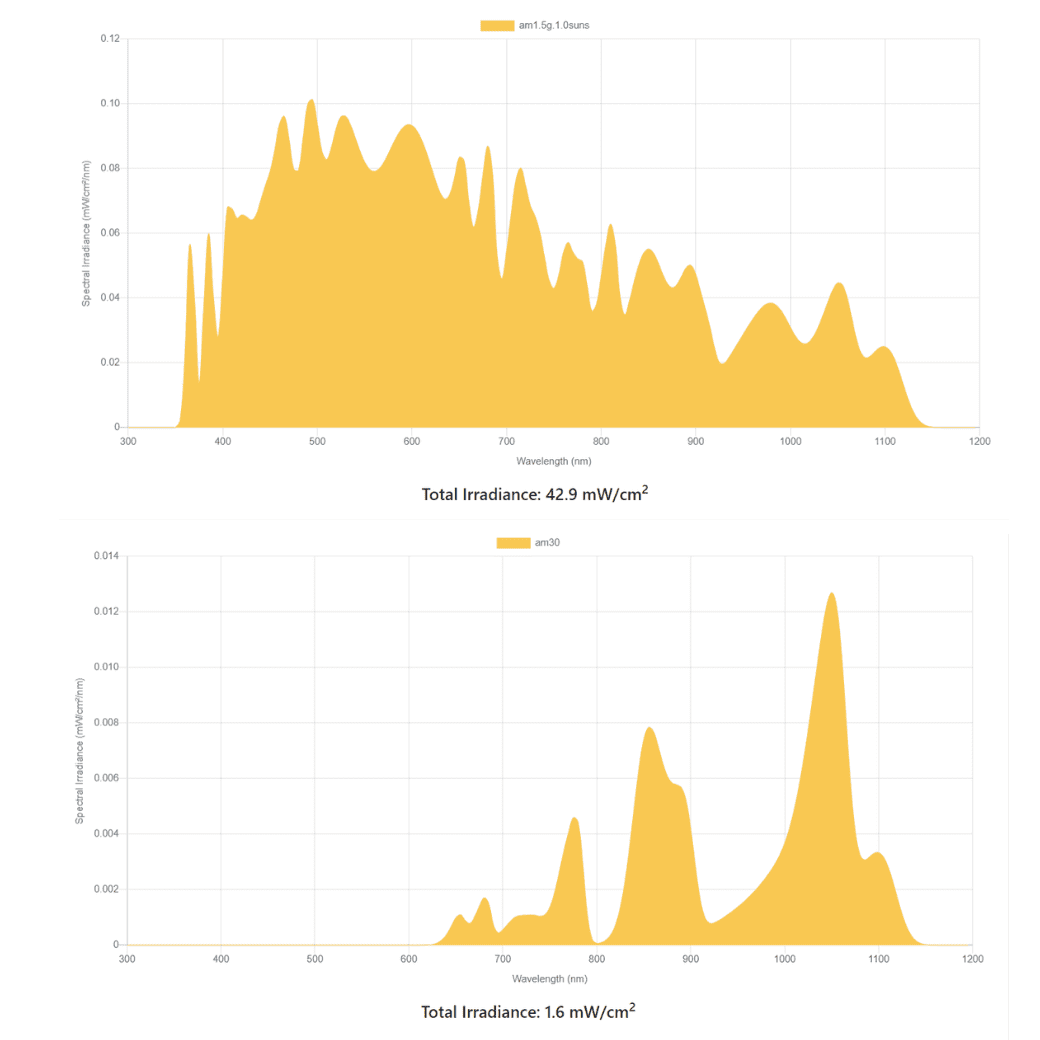
In the 400 nm to 1100 nm range, the standard integrated irradiance for AM1.5G is 759 W/m2 (or 75.9 mW/cm2). All of the wavelength portions outside of this range make up the remaining irradiance to bring the total to 100 mW/cm2. This is visualized below.
Spectral Irradiance of the AM0 Spectrum
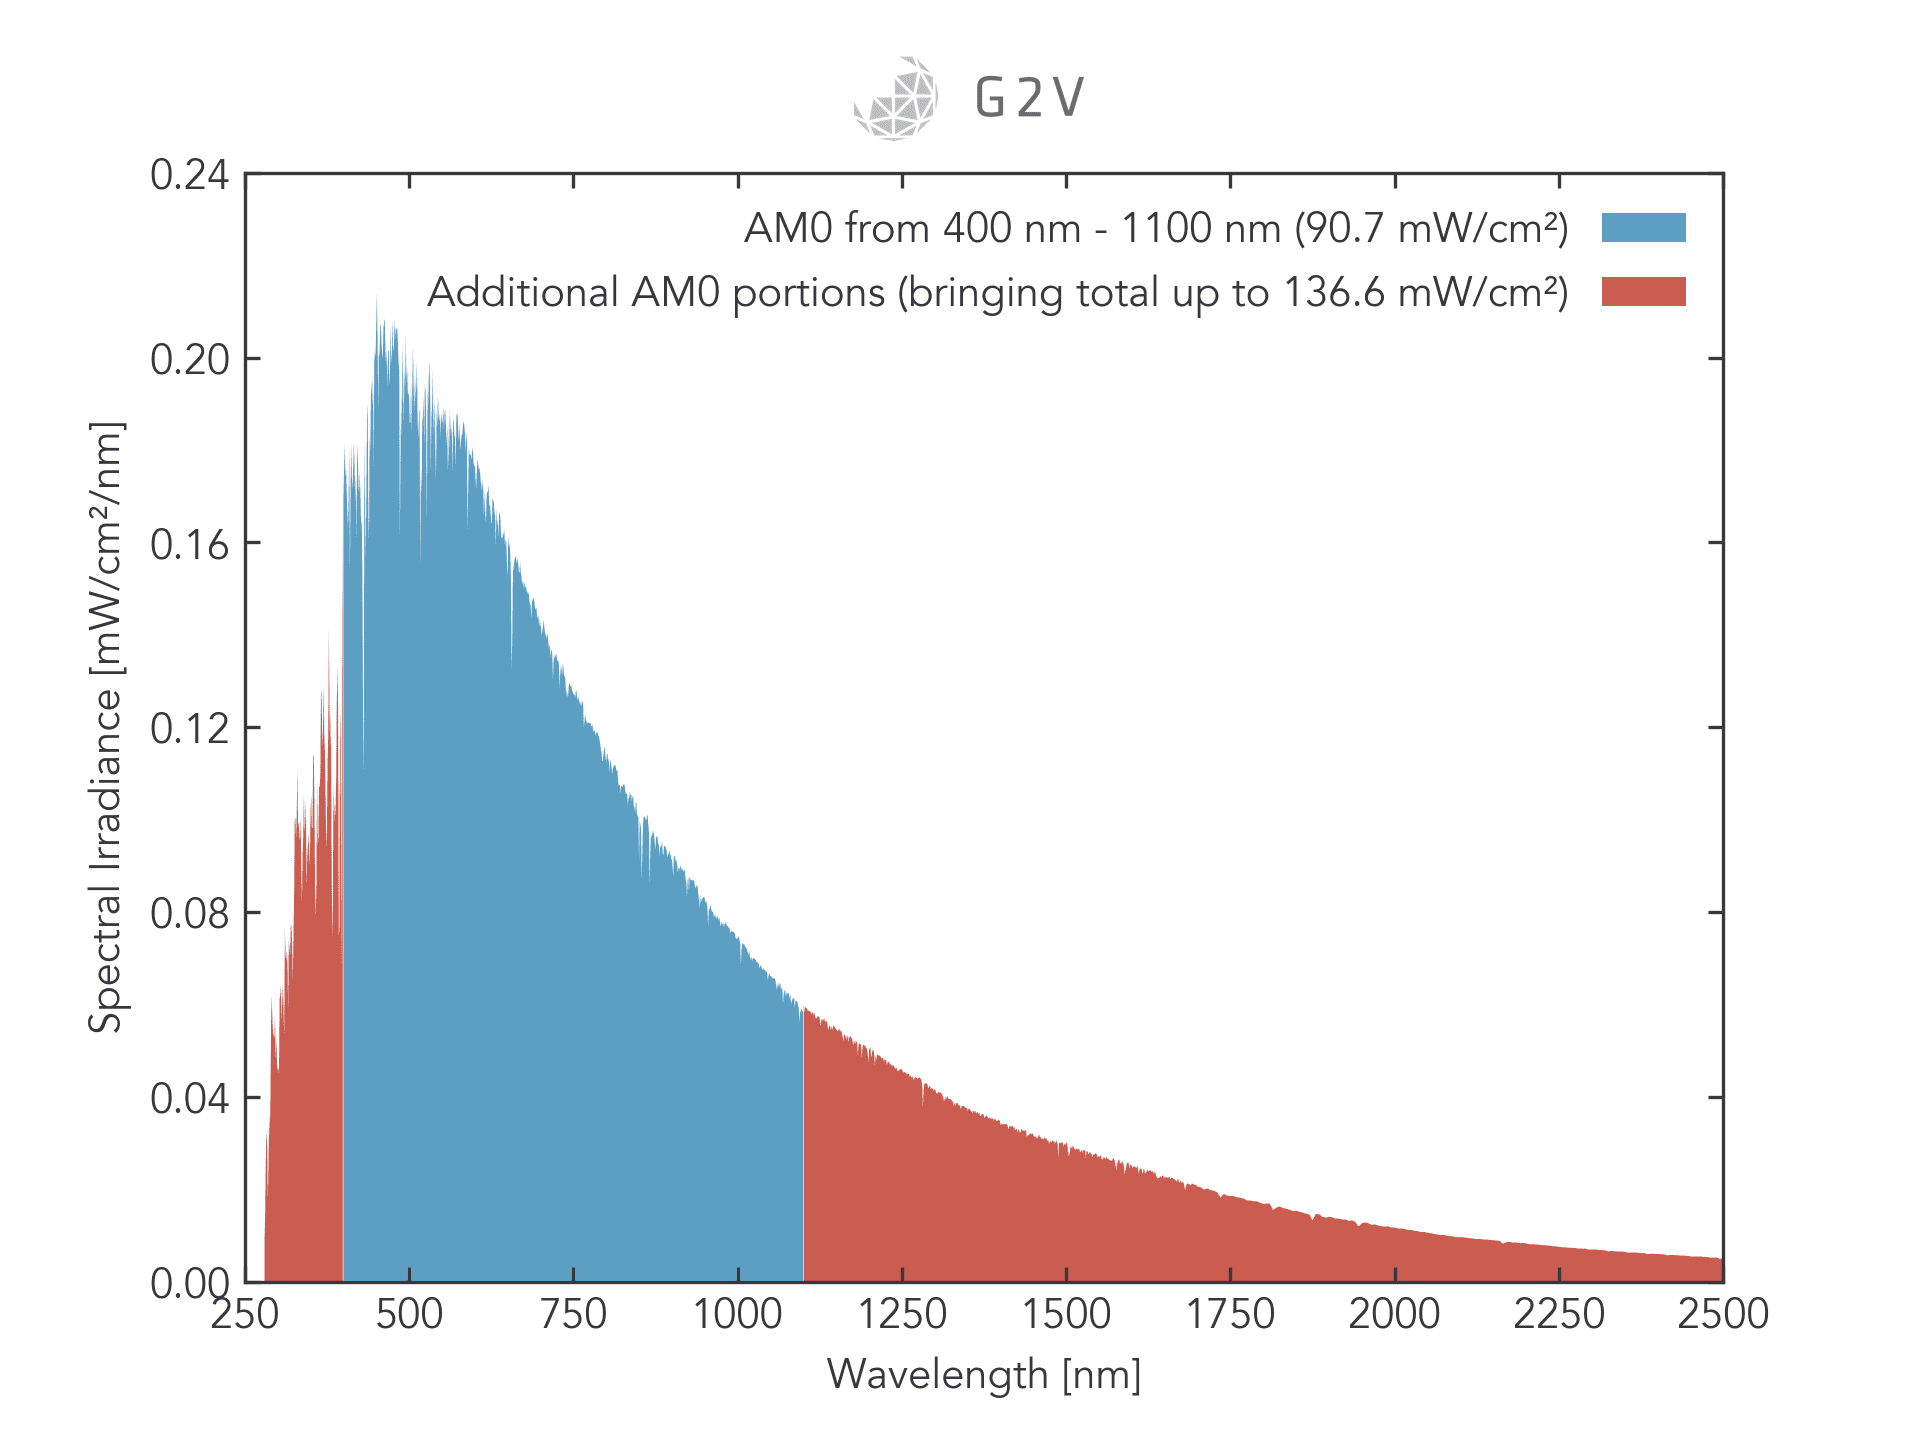
The same is true for AM0. The standard integrated irradiance for AM0 is 907W/m2 (or 90.7 mW/cm2). The wavelength portions outside of this range make up the remaining irradiance, bringing the total to 136.6 mW/cm2. This is visualized below.
Why is a Solar Simulator’s Spectral Irradiance Below 1000 W/m2 for AM1.5G?
When customers purchase an LED solar simulator for applications requiring the 400 nm to 1100 nm range, they often ask us why it appears to have a lower irradiance than the 1000 W/m2 standard.
The answer is that we are calibrating according to the irradiance for the specific portions of the spectrum we are generating.
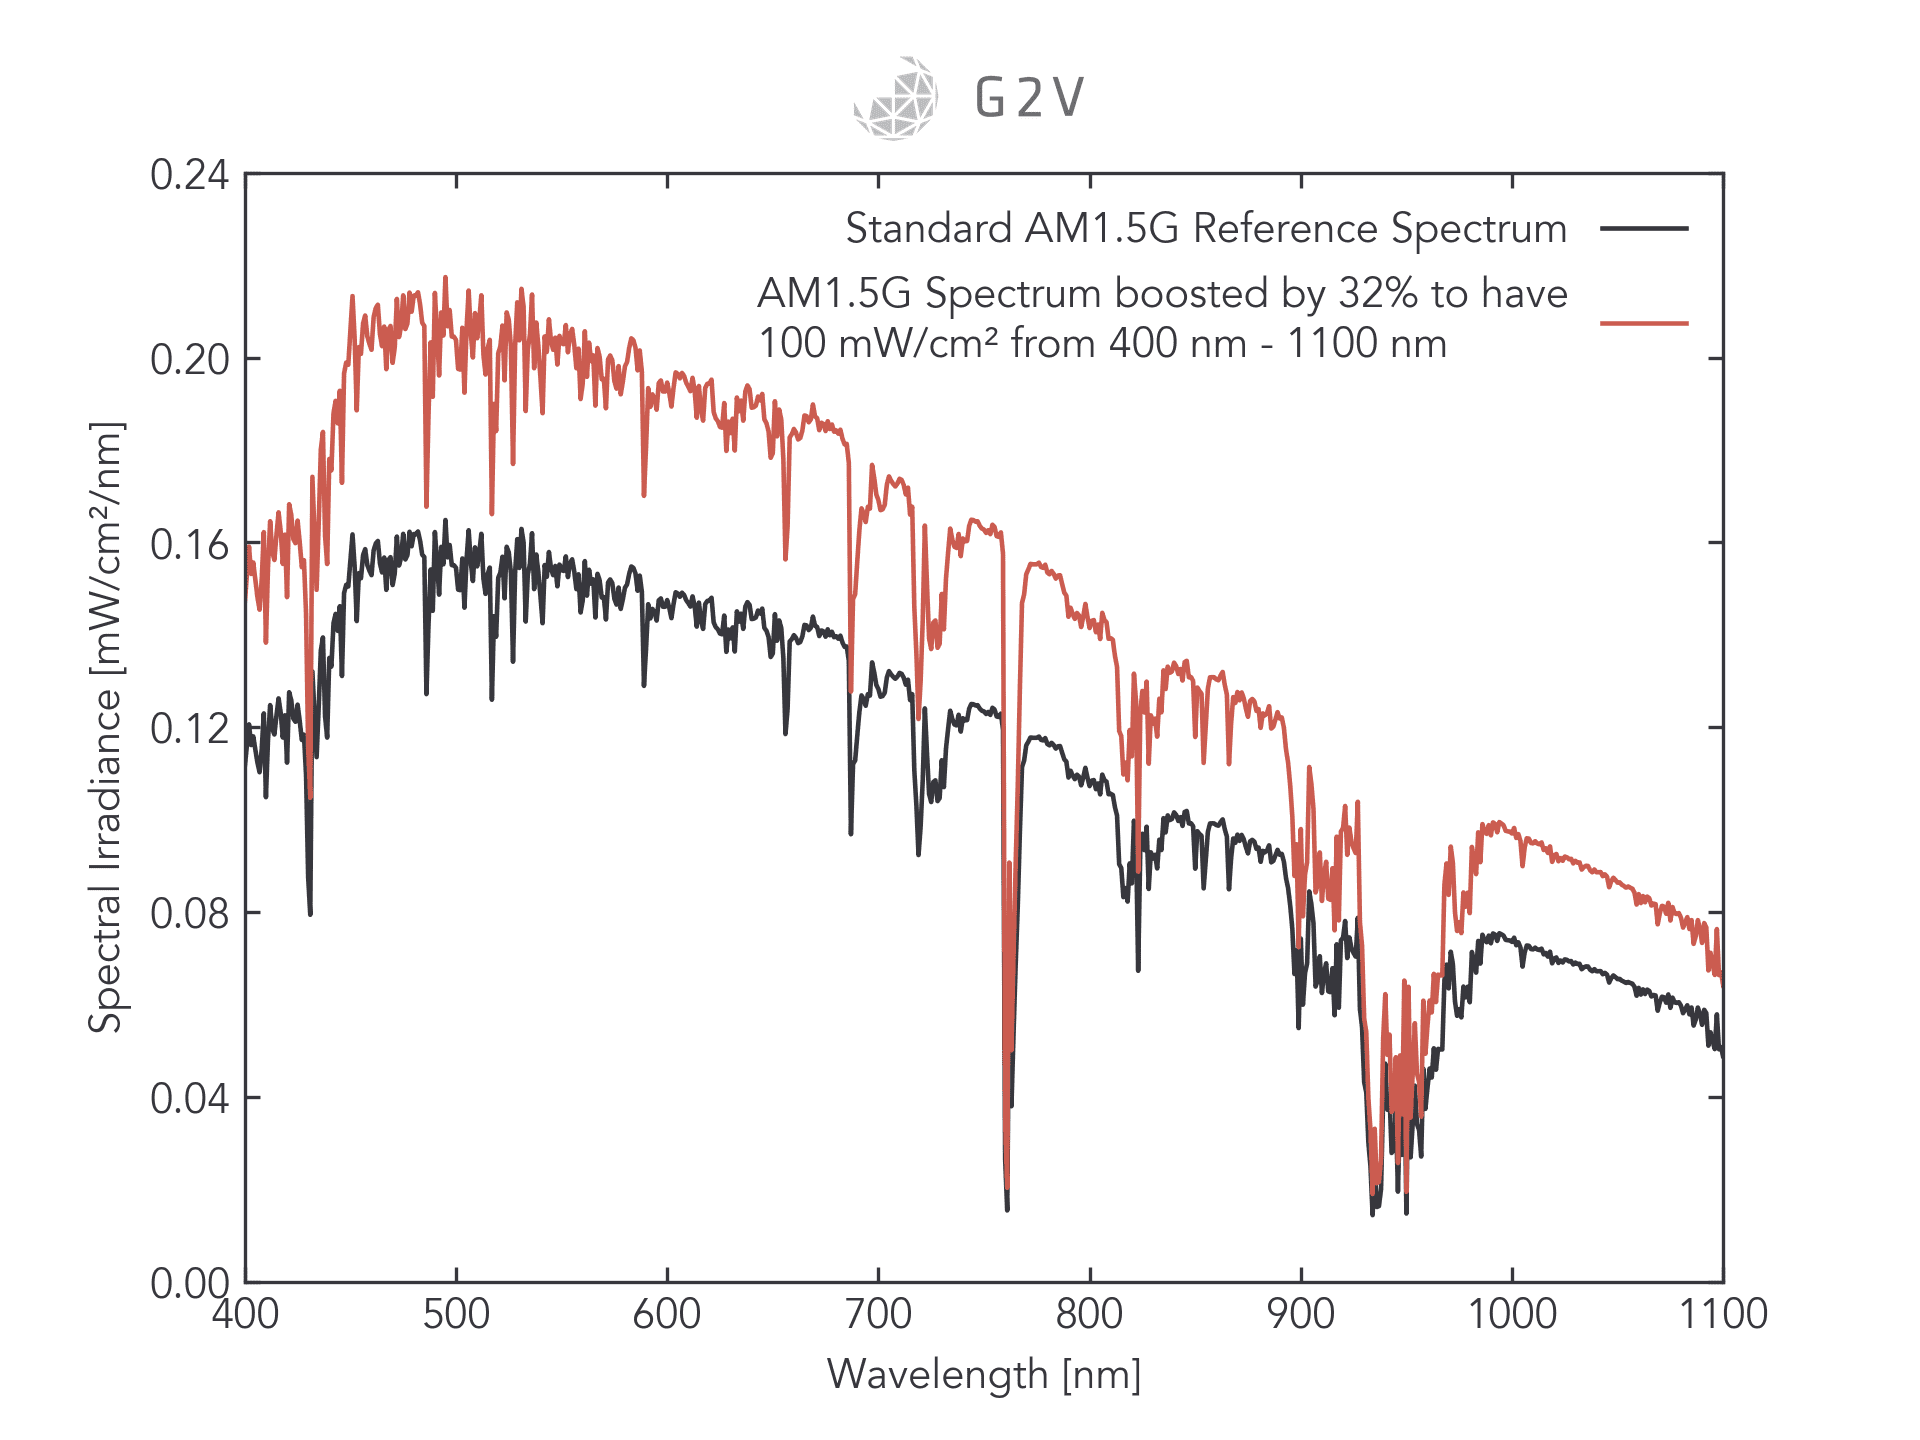
If we tuned our 400 nm – 1100 nm solar simulator to produce 1000 W/m2, we would be outputting an intensity across this range 32% higher than the standard! The figure below visually emphasizes how incorrect this approach would be.
Reference Solar Cells Vs. Optical Thermopiles

Things get particularly confusing when a silicon reference cell is quoted as having a given response under the standard 100 mW/cm2 (1000 W/m2) sunlight. This is because, as stated above, standard monocrystalline silicon solar cells only respond approximately in the 400 nm to 1100 nm range.
Therefore, there is no way such a reference cell can give any measure of the solar spectrum outside this range.
If you illuminated it with the appropriately balanced spectrum with 75.9 mW/cm2 irradiance over the 400 nm to 1100 nm range and then illuminated it with 100 mW/cm2 irradiance from the full 280 nm to 4000 nm range, you would measure the same output current from the reference cell.
The silicon reference cell is mostly blind to the spectrum below 400 nm and above 1100 nm.
In the industry the term “1000 W/m2” is often used synonymously with “standard sunlight”, without understanding the above-mentioned wavelength ranges and spectral balance. With this misused naming convention, silicon reference cells are sometimes mistaken as power meters. For many reasons beyond the ones stated above, they are not.
If you measure an LED solar simulator with a true power meter, i.e. one that will report the power contributions of all (or nearly all) wavelengths, such as a thermopile, then you will indeed measure the 30% difference between 75.9 mW/cm2 for a 400 nm—1100 nm solar simulator and 100 mW/cm2 for full-spectrum sunlight.
Understand Your Application’s Spectral Sensitivity
The most important to understand is the wavelength sensitivity of the phenomena under investigation.
If you’re using a solar simulator to study silicon solar cells, then, as discussed, you won’t be able to tell the difference between a solar simulator that emits 75.9 mW/cm2 from 400 nm – 1100 nm and one that emits 100 mW/cm2 from 280 nm – 4000 nm.
If you’re studying multi-junction solar cells extending to 1500 nm, you’ll want to ensure your solar simulator produces light out to that region. However, even going out to 1500 nm doesn’t raise the total irradiance to 100 mW/cm2, so insisting on this target irradiance can be misleading.
If you are investigating a physical phenomenon that depends on interactions across the entire 280 nm to 4000 nm wavelength range, you will need a solar simulator that produces 100 mW/cm2. However, in our experience, few physical phenomena depend so broadly on electromagnetic radiation.
If you’re studying material degradation whose mechanisms are primarily in the UV, a solar simulator that produces light at 1800 nm will be of little benefit because the latter will likely only result in a changed temperature. A correctly balanced spectrum in the regions of interest is much more important.
LED Solar Simulators vs Traditional Bulb-Based Solar Simulators
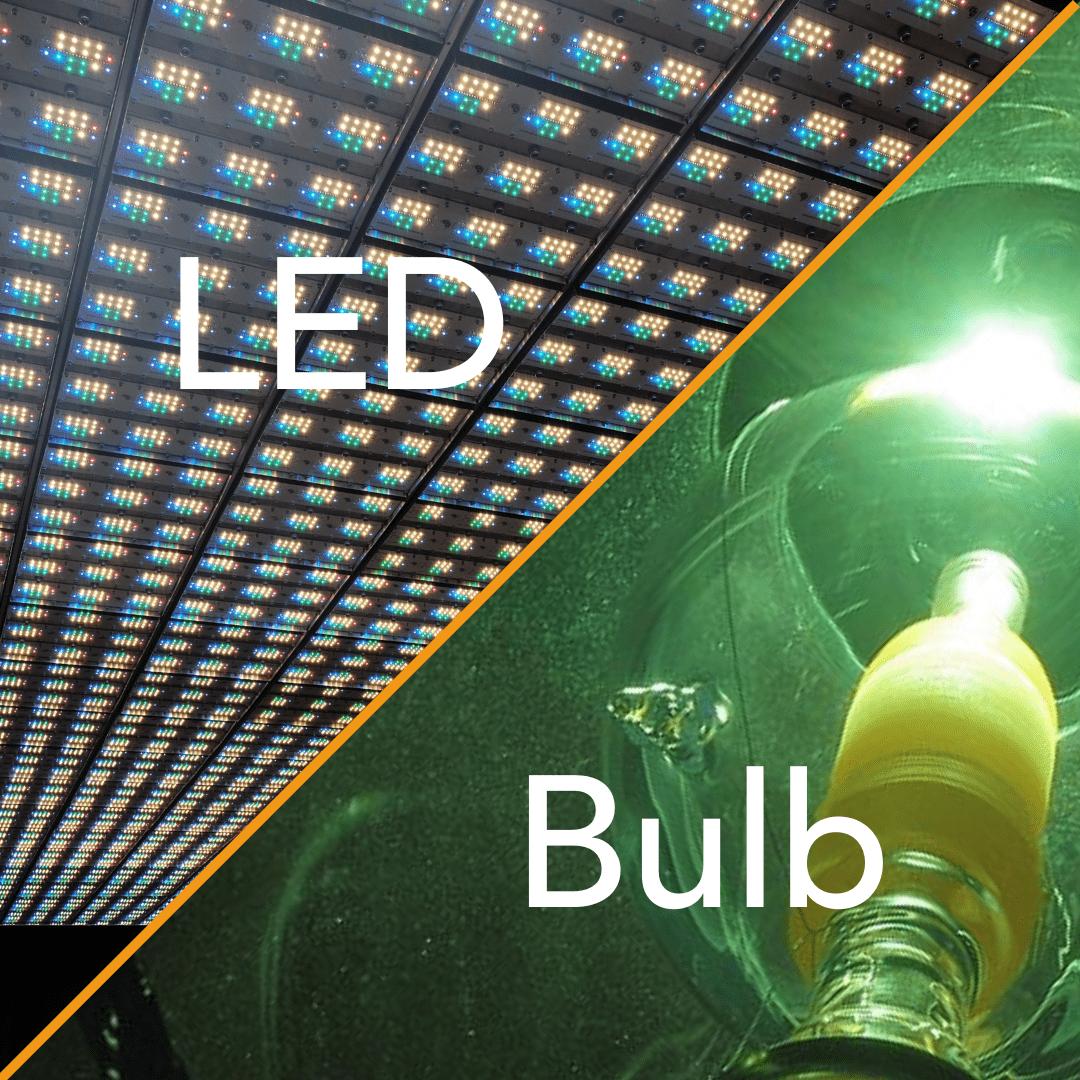
The concepts discussed above are relatively new to most solar simulator users because of how LED solar simulators are constructed. In contrast to traditional bulb-based solar simulators such as xenon arc or metal halide, LED solar simulators are built by combining several distinct sources of different wavelengths. If a portion of the spectrum is not needed, that LED isn’t used.
A xenon arc lamp or metal halide solar simulator, on the other hand, might produce a broader spectrum but have questionable spectral match, temporal stability, and spatial uniformity. They also emit excess infrared radiation, which results in excess heating of samples. Therefore, if your work is temperature-dependent, you must be aware that the additional heat may affect your results.
You might think the shorter spectrum range would disadvantage LEDs compared to bulb-based solar simulators, but this is not the case.
While it’s true that every portion of an LED solar simulator’s spectrum has to be intentionally constructed, this gives much more wavelength control and flexibility for the end user. This gives the ability to hone in on parts of the spectrum of interest, which is highly desired in photovoltaic tandem research.
If you like exploring parts of the solar spectrum, visit our solar simulator products page, highlighting our Class AAA instruments designed for end-user flexibility.
The Bottom Line for a Solar Simulator Spectral Irradiance
Ultimately, it all comes back to the wavelength sensitivity of whatever you’re trying to study. Your application’s needs will determine whether you want a full-spectrum solar simulator with a mediocre spectral match across the whole spectrum or one with an exceptional spectral match in key sub-regions of interest.