
Solar Simulator Prices – How Much Should a Solar Simulator Cost?
This article gives an overview of the necessary considerations when pricing and comparing solar simulators, and provides specific examples of the impact of a solar simulator’s quality on research. Additionally, we discuss how to estimate the return on investment (ROI) of such an important and complex testing tool.
What is a Solar Simulator?
Every day, companies, research centers, and laboratories around the world study novel materials and processes that involve sunlight. However, ensuring comparability between measurements during different times of the day, in various enclosed spaces, experimental settings, and in different geographic locations would be impossible without the aid of an identical, unchanging “miniature sun” in every research space.
Solar simulators (also known as sun simulators, artificial sunlight, or solar light simulators) solve this problem by producing illumination approximating natural sunlight to provide a controllable indoor test facility under laboratory conditions.
Solar simulators are designed to produce a similar intensity and spectral composition to that of natural sunlight.
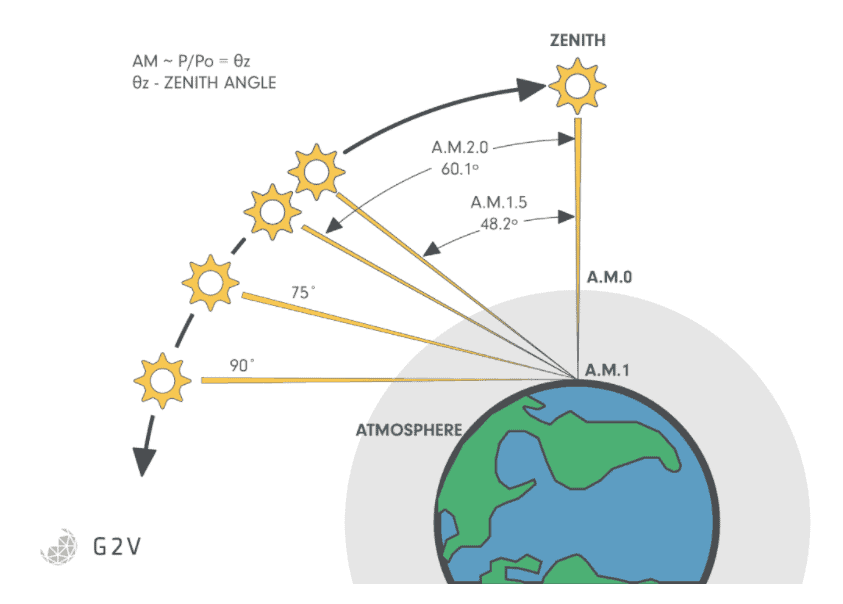
The spectrum of sunlight is standardized as AM1.5G (roughly meaning “Air Mass 1.5 Global”) for measurements at ground-level on Earth, and AM0 for measurements in outer space (where there is no atmosphere, or “Air Mass 0”).
Solar simulators are designed to produce at least one of these spectra (if not both). There are also many other air mass spectra such as AM2, AM10 and so on that represent sunlight at higher angles (for example, at sunrise and sunset).
Some solar simulators produce these less-common spectra as well and provide a higher degree of necessary flexibility for some users.
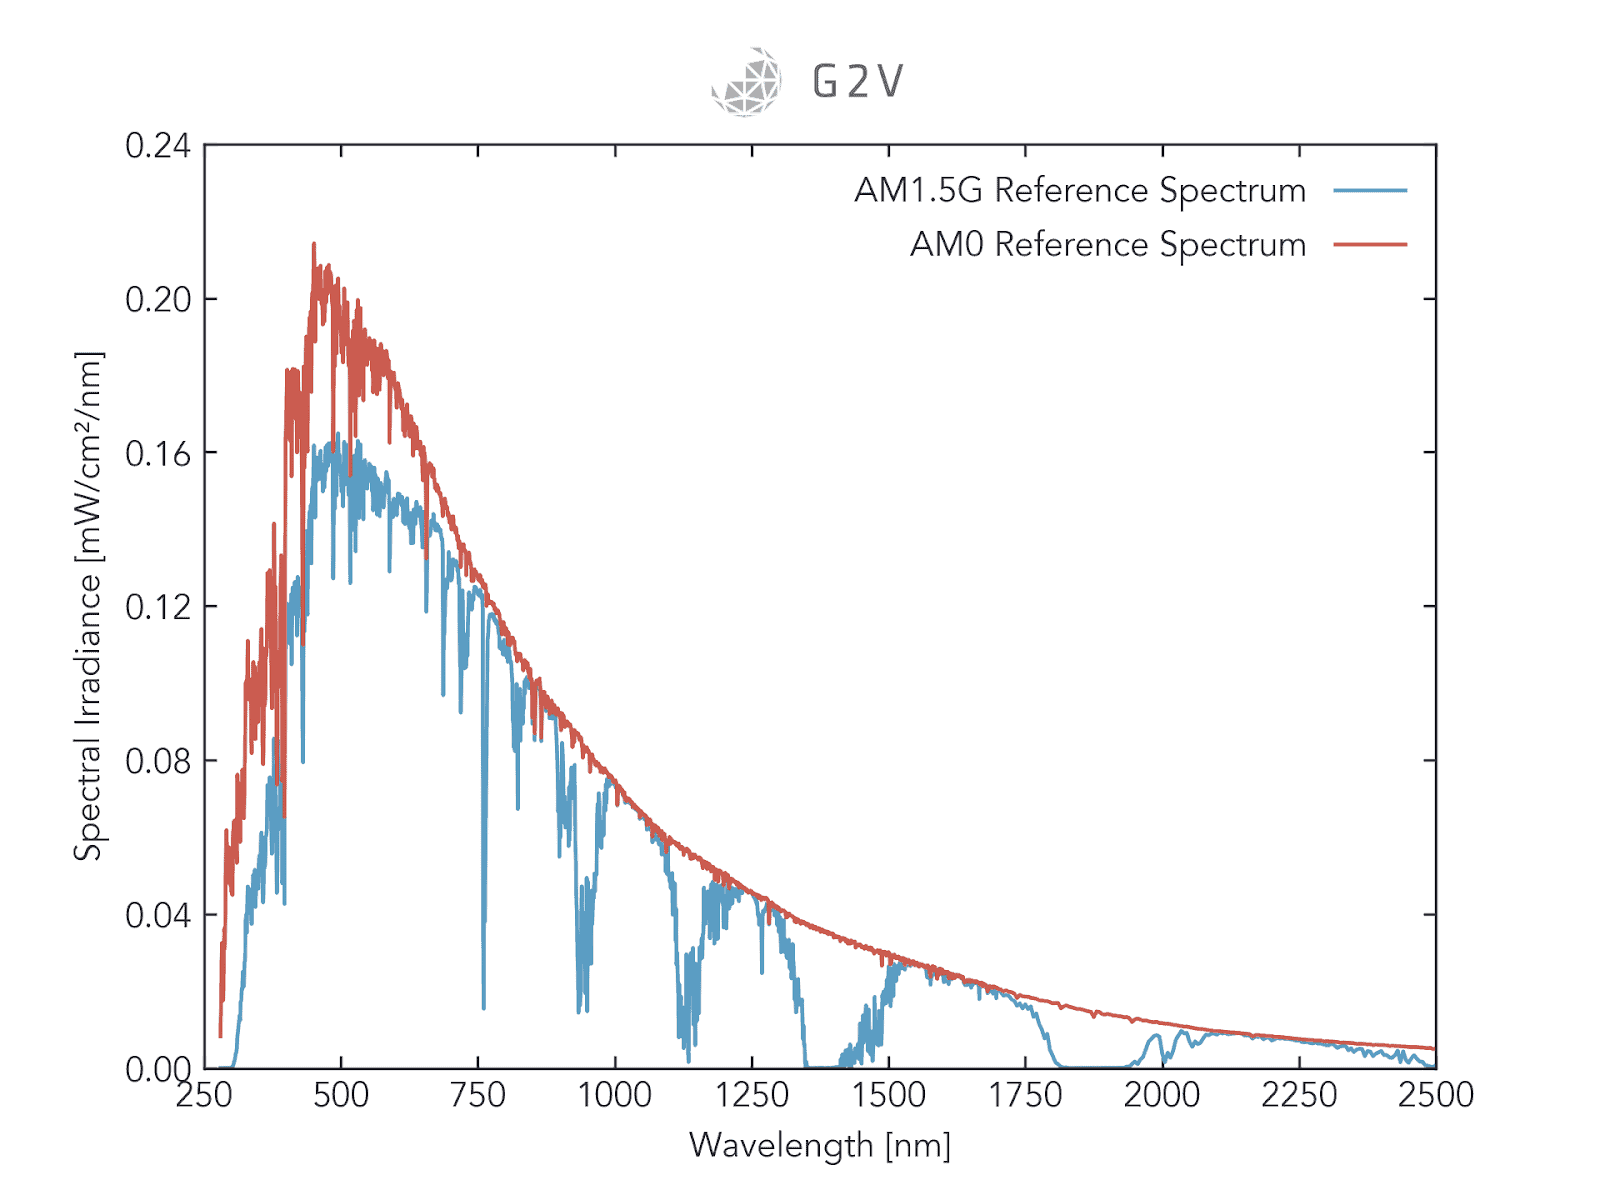
A rough visual summary of where the AM0 and AM1.5G sunlight standards can be observed on Earth and a plot of the sun’s intensity versus wavelength (i.e spectrum) for each is shown below.
For more information about solar simulation and this background terminology, please refer to our comprehensive solar simulation article.
Solar Simulator Selection Criteria
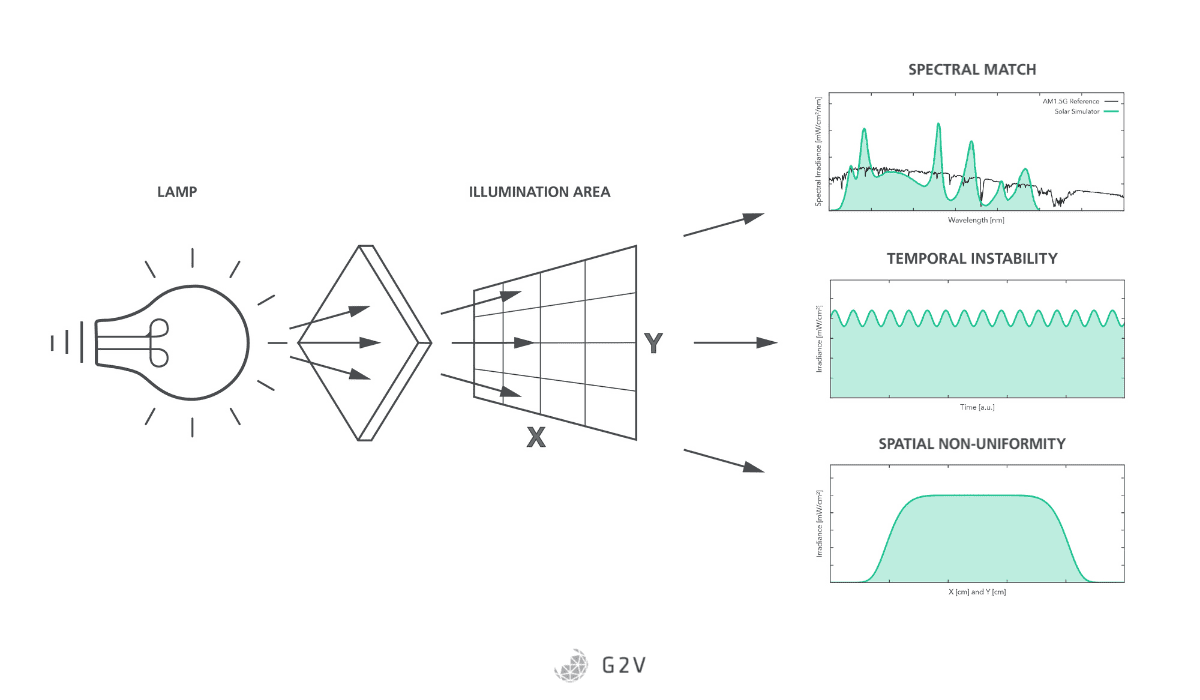
At a very basic level, solar simulators are made up of light sources and optical components with mechanical and electrical additions to support each.
While the optics (lenses, mirrors and such) do play a role in a solar simulator’s performance, a simulator’s ability to reproduce sunlight is mostly driven by the type of light source.
The two broad categories of light sources used in solar simulation are incandescent bulbs and light-emitting diodes (LEDs).
Knowing about each is important when considering both the initial and long-term cost of owning a solar simulator. Some of the advantages of different technologies don’t necessarily have an easily quantifiable monetary benefit, but they nevertheless can have a dramatic impact on the final solar simulator application, as we’ll discuss below.
Solar Simulator Lamp Technologies
There’s an additional caveat on the Class A+ classification, which reflects the need to meet the expanding needs of photovoltaic researchers (discussed above). For a solar simulator to qualify for the Class A+ designation in any of the 3 metrics, the solar simulator must be evaluated across the extended range of 300 nm to 1200 nm (and its spectral match evaluated accordingly). This new wavelength range has different bin divisions from the original 400 nm to 1100 nm standard, which are given in the tables below for comparison (consolidated from the standard). You’ll notice that the new bin divisions are done in such a way that the percentage of the total irradiance in each spectral bin is about the same — i.e. each bin covers roughly the same fraction of the total spectral irradiance.
Incandescent bulbs
Incandescent bulbs rely primarily on blackbody radiation — the radiation produced by a hot object — to produce sunlight.
Sunlight itself is approximated by a blackbody spectrum at nearly 6000 °C, so there’s a natural alignment of the fundamental physics with this approach.
However, it’s difficult to get a long-lasting material that will operate at this high temperature. The incandescent bulbs for solar simulation are not typical incandescents found in household lighting.
To achieve the high blackbody emission temperature needed, bulbs are manufactured using xenon gas, or metal halides in mercury vapour. An electrical arc is then passed through these gases to produce a high-temperature plasma, hence emitting blackbody radiation at the desired high temperature.
For the most part, this incandescent bulb approach is successful. Their two main advantages are that they produce broad-spectrum light and that they produce it from a single lamp, which makes the optical design simpler to produce collimated light. A beam of light is termed “collimated” when all its rays are parallel to one another, which is the case for sunlight. Some applications are sensitive to the angular distribution of light, and some aren’t.
However, there are several things that keep incandescent bulbs from perfectly reproducing sunlight, or that make their use less convenient for end-users:
- Because of the gases involved, their emitted spectra contain strong and sharp gas emission lines in the near-infrared region that need to be filtered out. Even with filters, however, some emission peaks remain in the red and near-infrared regions causing spectral mismatches that may produce inaccurate results in some applications.
- Their emission in the infrared is generally higher than the solar spectrum, which means they produce excess heat which needs to be managed and considered in any testing — either through costly additional HVAC systems, sample temperature control, or other setup considerations. The requirement for additional sample management systems can have a huge impact on research time, effort, and setup costs.
- Because of the high-temperature processes involved, the bulbs degrade over time, requiring regular recalibration and/or replacement (on the order of every 1,000 hours).
- The required optical filters can degrade over time and burn out from prolonged radiation exposure.
- They require long warm-up times for stable output ( on the order of 30 minutes depending on the application and instrument. As we’ll discuss below, this additional time can have a major impact in a research lab).
Light-emitting diodes (LEDs)
Light-emitting diodes (LEDs) are the other main light source technology used in solar simulation.
LEDs are solid-state devices that produce a relatively narrow-band emission of light when an electrical current passes through them.
The exact colour of light emitted depends on the diode material. Because they emit in a narrow band, many LEDs need to be combined so their net emission creates a solar spectrum. However, because an LED solar simulator contains many discrete sources, many LED solar simulators offer the ability to fine tune specific wavelength ranges (by adjusting individual LEDs) toward far greater spectral control. Additionally, LEDs have long lifetimes and do not significantly degrade through repeated on-off cycling.
In the past, material science limitations prevented LEDs from producing light both bright enough and of all the right wavelengths for good solar simulation. That limitation has now been surpassed and high-power commercial LEDs are available in a very wide spectral range, with more being regularly developed and released.
LEDs are very efficient, producing very little excess heat, and requiring less energy than conventional incandescent bulbs. They have longer lifetimes (on the order of 100,000 hours) and can produce a stable output much more quickly than incandescent bulbs (on the order of seconds or minutes depending on the number of LEDs and configuration). Some of their disadvantages include:
- They are only available in discrete wavelengths determined by material science limitations.
- More newly-developed LEDs producing light below 360 nm or above 1100 nm can be costly.
- Because multiple lamps (LEDs) are needed, it is more challenging to produce collimated light from these solar simulators. Some solar simulators can produce an angularly distributed beam with a full-width at half maximum (FWHM) of between 15o and 30o, which is sufficient for many applications.
Criteria when Evaluating LED vs Incandescent Bulb Solar Simulation Technology
A summary table of the various costs and benefits associated with different solar simulator lamp types is given below.
Table of Solar Simulator Lamp Considerations |
|||
| Typical Solar Simulator Specifications | Lamp Type1 | ||
| LED | Incandescent bulbs | ||
| Xenon arc | Metal halide | ||
| Initial Capital Cost | $–$$ | $–$$ | $–$$ |
| Average source lifetime | 10,000-50,0002 hours | 1,0002 hours | 1,0002 hours |
| Replacement bulb cost Times Frequency |
$ High replacement cost ($400-$4,000 USD), but infrequent (every ~7 years) |
$$ Medium replacement cost ($500-$1,500 USD) but very frequent (every ~0.7 years), with supply-chain problems3 |
$$ Medium replacement cost ($500-$1,500 USD) but very frequent (every ~0.7 years), with supply-chain problems3 |
| Filters required | No | Yes (~$1,000 USD each) |
Yes (~$1,000 USD each) |
| Electronics require regular replacing | No | Yes Sometimes this cost is included in bulb replacement |
Yes Sometimes this cost is included in bulb replacement |
| Average Spectral Range | 350 – 11004 | 300 – 20004 | 300 – 20004 |
| Spectrum Adjustment | Individual LED adjustment via software5 | By filters only | By filters only |
| Angular distribution of light (sunlight is collimated | Varies from Lambertian to Directed (15o-30o FWHM) | Varies, but can more easily produce collimated light | Varies, but can more easily produce collimated light |
| Relative Spectral Deviation (lower is better) |
Low | Medium | Medium |
| Relative Spectral Coverage (higher is better) |
Depends on Manufacturer6 | High | High |
| Spectral Match (Class AAA is best) |
Depends on manufacturer | Depends on filter | Depends on filter |
| Spatial Non-uniformity (Class AAA is best) |
Depends on manufacturer | Depends on manufacturer | Depends on manufacturer |
| Temporal stability (Class AAA is best) |
High | Medium | Medium |
| Modulation ability | Strong | Weak | Weak |
| LEGEND $ – low cost, $ – medium cost, $$- high cost | |||
| 1. Plasma solar simulators, supercontinuum lasers, and multi-source systems are some other types of emerging solar simulator technologies but not enough academic information was available to provide an objective comparison. | |||
| 2. These are conservative estimates from studies — some techniques may extend lifetime, and LED technology in particular continues to improve. | |||
| 3. Reported by some high-intensity discharge solar simulator lamp manufacturers. | |||
| 4. LED solar simulators extend beyond this range, to 1200 nm or 1500 nm depending on the product model. For many applications the excessive IR from incandescent bulbs is actually a setback as it requires sample management or HVAC systems. | |||
| 5. Only some LED solar simulators allow individual LED control. | |||
| 6. LED solar simulators have high (100%) spectral coverage; see our article here for more information. | |||
The Value of Better Solar Simulation Technology
The value of a solar simulator’s technology type is hard to monetize but is scientifically invaluable.
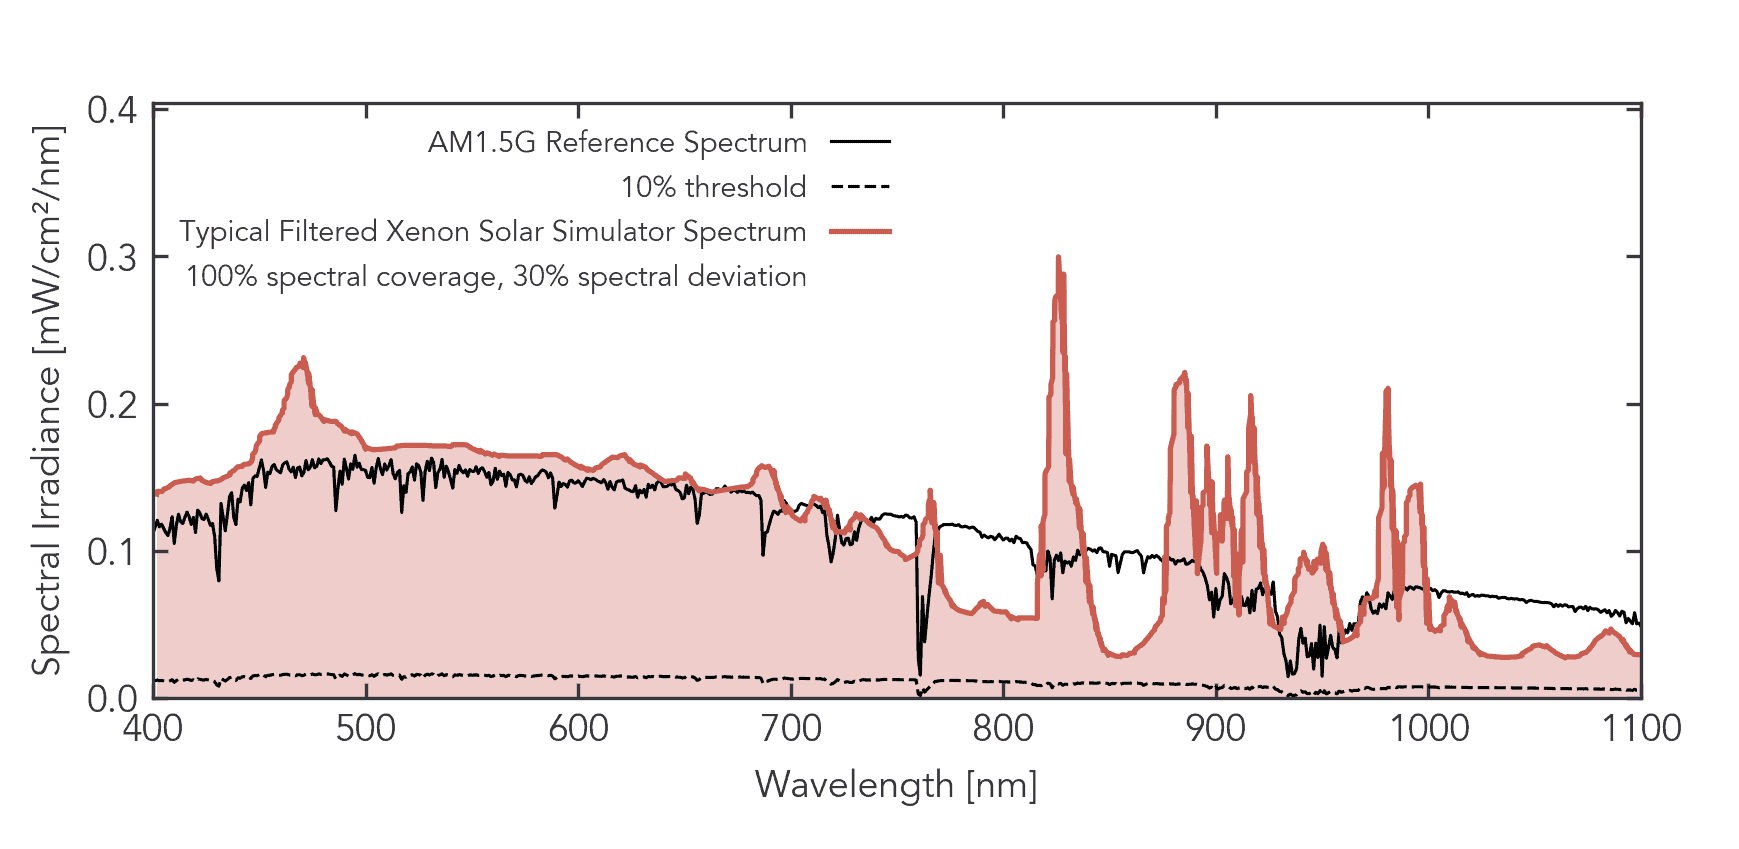
For instance, since xenon bulbs produce a spectrum with considerable mismatch in the near IR and UV regions (see the figure below, or other plots in our IEC article), additional expenses are inevitable in terms of filters, filter maintenance, and calibration hours. It’s important to note that filters cannot completely suppress the mismatched irradiance spikes without significantly altering the rest of the spectral profile. In contrast, LEDs can produce a smooth spectrum without the need for additional hardware aids [Bliss et al., 2008].
An instrument’s versatility needs to match the experimental needs. In a busy lab setting with multiple users, long warm-up times are more costly than in a lab with a single solar simulator user.
This is the case not only because of the additional time and scheduling required to coordinate experiments but also because there are a few situations where a long warm-up time might result in users operating a solar simulator before it’s warmed up, leading them to obtain unreliable data which may need to be repeated. Some examples where this situation might occur are when a user forgets to prime the solar simulator before a measurement, when a sample requires immediate on-demand evaluation, or when there is simply an urgent need to measure before the end of the workday. In these cases, minimizing warm-up time by choosing a low-warm-up time solar simulator will have a dramatic impact on the quality of research done by multiple teams.
LEDs have start-up times in the order of μs-ms and a short time on the order of seconds to minutes for complete thermalization with their surroundings. Thus, for many applications, an LED simulator will eliminate this expensive wait time.
For traditional xenon bulb sources, where output intensity varies with the temperature, sample pre-conditioning or reduced irradiance testing is considerably difficult and requires additional hardware [Leary et al., 2016].
In contrast, because LEDs can be dimmed without significant variance from a target spectrum, more realistic indoor or outdoor testing is possible. For example, the ability to quickly adjust the spectra to match various environmental conditions (e.g. cloudy, red-rich sunset, varied latitudes, etc. spectral profiles) further enhances the experimental testing options possible with LED solar simulators [Bliss et al., 2008].
For laboratories evaluating multi-junction solar cells, there is considerable benefit from easily evaluating cells at specific wavelengths, for example, via a simple software interface rather than by relying on elaborate filters or additional lamp sources. Experimental research requires eliminating as many external interference variables as possible.
How do you Measure the Quality of Solar Simulators?
Before we discuss the added factors affecting solar simulator price, we have to first understand how solar simulators are qualified.
Solar Simulator Standards: Primary Metrics
There are three primary metrics used to measure the quality of solar simulators and that are referenced in numerous standards, including ASTM E927, IEC 60904-9, and JIS 8912:
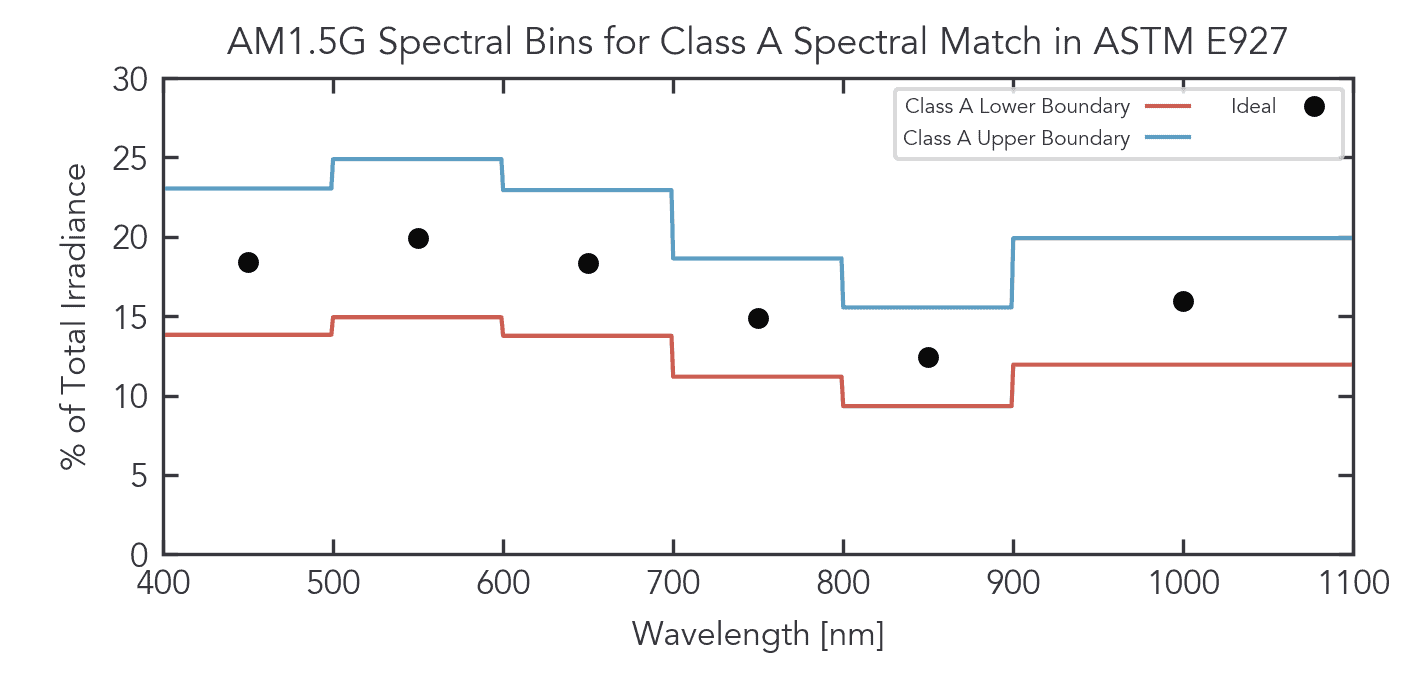
- Spectral match: How closely the solar simulator’s total spectral irradiance in certain wavelength ranges matches that of AM1.5G or AM0. This is given as a percentage of the total irradiance in six spectral “bins” and is allowed to deviate by as much as 25% for a Class A spectral match, and 12.5% for Class A+ (for IEC 60904-9:2020 only).
- Spatial Non-Uniformity: This is a measure of how uniform or flat the illumination field is over the area of measurement. It is calculated roughly by the difference between the maximum and minimum intensities as you move around a solar simulator’s illuminated area. A spatial non-uniformity of 2% is considered Class A and 1% is Class A+ (for IEC 60904-9:2020 only).
- Temporal Instability: This is a measure of how stable the output of the solar simulator is over time, and is usually defined for both long-term and short-term situations, referred to as long-term instability (LTI) and short-term instability (STI). It is calculated roughly by the difference between the maximum and minimum intensities over time. An LTI of 2% and a STI of 0.5% are considered Class A in this category, while LTI of 1% and STI of 0.25% achieves Class A+ (for IEC 60904-9:2020 only).
Thus, the quality of a simulator can be classified as AAA, ABA, BBA, etc. depending on how well it meets these three metrics.
Solar Simulator Standards: Secondary Metrics
Two secondary metrics can be used to more deeply measure solar simulator quality:
- Spectral Coverage (SPC): This is the percentage of the sun’s spectrum that is covered by a solar simulator’s output. If a solar simulator only emits light from 450 nm to 1050 nm (rather than 400 nm to 1100 nm), the solar simulator would have a rough spectral coverage of 86%. A higher spectral coverage is better. This parameter was introduced in IEC 60904-9:2020.
- Spectral Deviation (SPD): This is the total extent to which a solar simulator goes above or below the sun’s spectrum. A solar simulator with intensity peaks much brighter or far dimmer than the sun would have a high spectral deviation, while one whose intensities more closely match the sun’s brightness at different wavelengths will have a low spectral deviation. A lower spectral deviation is better. This parameter was introduced in IEC 60904-9:2020.
A summary of the requirements for Class A+, A, B, and C in each category for IEC 60904-9:2020 is included in the table below.
Note that each Class supersedes the one below it: i.e. Class A+ also meets the criteria for Class A, while Class A also meets the criteria for Class B, and so on.
| Classification | Minimum Wavelength Range to be Evaluated (nm) | Spectral match to all spectral bins (%) |
Spatial non-uniformity (%) |
Temporal instability | |
|
Short term instability (STI) % |
Long term instability (LTI) % |
||||
| A+ | 300-1200 | 87.5 to 112.5 | 1 | 0.25 | 1 |
| A | 400-1100 | 75 to 125 | 2 | 0.5 | 2 |
| B | 400-1100 | 60 to 140 | 5 | 2 | 5 |
| C | 400-1100 | 40 to 200 | 10 | 10 | 10 |
Solar simulator classification table condensed from the IEC 60904-9:2020 Standard.
| Parameter | Mathematical Definition | Explanation | Desired Value |
| Spectral Coverage (SPC) | ![[Q4-FY2021] Solar Simulator pricing 5](https://g2voptics.com/wp-content/uploads/2021/12/pasted-image-0-1-7.png "[Q4-FY2021] Solar Simulator pricing 5") |
Percentage of the sun’s spectrum covered by a solar simulator’s output |
High (100%) |
|
Spectral Deviation (SPD) |
![[Q4-FY2021] Solar Simulator pricing 6](https://g2voptics.com/wp-content/uploads/2021/12/pasted-image-0-2-2.png "[Q4-FY2021] Solar Simulator pricing 6") |
Extent to which a solar simulator goes above or below the sun’s spectrum | Low (<30%) |
Secondary solar simulator characteristics to consider, taken from the IEC 60904-9:2020 Standard. These are not yet required for A/A+ classification in the standards, but differentiate passable from exceptional solar simulators.
These 5 metrics matter because they can validate or invalidate the tests carried out by a solar simulator.
A poor solar simulator can increase the amount of post-processing or analysis necessary for researchers to relate their measured performance to the real world (for specific examples, see the examples on photovoltaic corrections in the section below).
In the worst-case scenario, a poor simulator can produce misleading responses from target samples which could cast doubt on experimental reproducibility between different rounds of experiments or between different published results.
The Impact of Solar Simulator Classification on Research
In this guide, we do not assign a monetary value to the research impact of poor beam uniformity, temporal stability, or spectral match. However, it is well known that when probing subtle device behaviours (e.g. the response of the bulk heterojunction of organic solar cells to post-deposition treatments like the study reported by Aghassi and Fay, 2019), statistical uncertainty can mean the difference between publishing a scientific discovery or falling down a rabbit hole.
Let’s take the example of a photovoltaic researcher.
If a solar simulator’s beam is highly non-uniform, putting in a larger detector or reference cell outside the central area means that the edges of the solar cell are exposed to a much lower intensity than the central area, resulting in a lower photocurrent which might lead to the incorrect conclusion that the solar cell’s efficiency is lower or higher than it really is.
Spatial non-uniformity affects the overall shape and characteristics of the measured solar cell’s I-V curve, as is shown in the image below.
Furthermore, for many researchers who are looking to investigate the impact of different chemical processes on solar cell efficiency, errors introduced by a poor-quality solar simulator can lead to incorrect conclusions about the best methods and research paths to pursue.
A researcher’s laboratory-measured efficiency might greatly differ from a device’s certified efficiency. The reference or “gold standard” of solar cell efficiency records is produced by NREL as shown below. Not every lab can test to the high standards exhibited at NREL, but they strive to eliminate as many sources of error as possible before their device is sent to NREL.
This minimization of error is why some researchers have their own devised methods for assessing and correcting for spatial non-uniformity [ECRJC 2020], because the solar simulator standards do not necessarily provide the resolution of spatial non-uniformity needed for small devices.
If a solar simulator has better spatial uniformity, these corrections are no longer needed, and the researcher doesn’t have to spend as much time justifying or questioning their conclusions.

Additionally, photovoltaic researchers also have stringent requirements for temporal instability because the generated photocurrent follows the fluctuations in light intensity [Reese, M.O. et al. 2017].
Correction factors become more complicated in time-sensitive experiments (e.g. in accelerated degradation or continuous illumination testing). In incandescent simulators that irradiate heavily in the infrared, small shifts in Voc and Isc values occur as a function of increased substrate temperature and because the irradiated light from the bulb will shift from blue to red over several (200 h) hours of use [Leary et al., 2016].
Controlling thermal effects can be a challenge when testing protocols that call for a fixed temperature (e.g. ASTM E1012-15, which specifies that a photovoltaic device’s junction temperature must be controlled in order to quantify its responsivity). These time-dependent temperature effects may be controlled by post-processing methods or with the use of monitoring photodiodes to assess temporal fluctuations of irradiance [Reese, M.O. et al. 2017]. However, these additional techniques add layers of complexity and time drains that could be entirely avoided with an advanced simulator.
Finally, like the other two primary solar simulator metrics, spectral match is also a chief concern for researchers.
In general, better spectral match yields more accurate results, but the real impact of this parameter can be seen in the number of compensatory calculations needed for solar simulators with varying spectral match.
For example, in this 2020 publication by Ye, S. et al, researchers had to develop their own methods to account for the spectral mismatches of three different Class AAA solar simulators in order to reduce the 10% error they were observing in the measurement of their perovskite solar cell efficiencies.
There are extensive guides written for compensating for the spectral mismatch of solar simulators [Reese, M.O. et al. 2017].
Such results indicate that not all Class AAA solar simulators are created equal and underscores the need for better quality solar simulators that can bypass such compensatory calculations.
The secondary metrics of spectral coverage and spectral deviation offer some insight to differentiate passable solar simulators from exceptional ones.
The Bottom Line for Solar Simulator Classification
The required Class of solar simulator — whether ABA, ABC, BCB or something else — is driven by what needs to be tested, and how sensitive the underlying processes are to the various parameters of spectral match, spatial non-uniformity, and temporal instability.
In most cases, a higher-class solar simulator means more time for researchers to think about and work on the materials or physical processes they are trying to study, and less time trying to correct for the quality of their solar simulator.
How Should You Cost Out a Solar Simulator?
A solar simulator is more than just an expensive flashlight and when buying one, it’s important to consider more than just its sticker price.
Many solar simulators are Class AAA, meaning they have an excellent spectral match, spatial non-uniformity, and temporal instability, but even then, the quality varies widely from one manufacturer to another.
Spectral coverage and spectral deviation are two new metrics that give buyers more information to differentiate passable from exceptional solar simulators.
Better solar simulation ultimately means better, faster testing and research, and more reliable results.
Beyond a solar simulator’s base performance and its sticker price, are operational considerations such as:
- the fundamental technology that drives annual maintenance,
- bulb replacement,
- filter replacement,
- spectral tunability.
How much benefit a user can really glean from a solar simulator is also determined by the device’s:
- ease-of-use,
- maintenance requirements,
- and the extent to which lab test results have to be corrected before their conclusions can be more broadly applicable to devices/materials in real-world environments.
All of these factors should be considered during solar simulator pricing evaluations and equipment investigations.
The initial sticker price and classification of the solar simulator should not be your only cost considerations. Maintenance and other operating costs, usability, along with useful module add-ons, and interoperability with other testing tools should all be considered in selection and cost evaluation.
Direct Maintenance Costs
As we explained above, the light source technology chosen determines the number of hours of operation before requiring replacement, which can be summarized by an estimated bulb replacement cost per year.
Also important to consider are the additional parts that need to be regularly maintained and/or replaced in order to maintain the quality of the solar simulator. Remember, an inexpensive Class AAA solar simulator that lasts a month is likely to be a drain in the long-term, from a material cost perspective.
Parts and components to consider in the replacement cost category include optical filters, any coated optical components, power supplies, and drive electronics.
Indirect Operating Costs
Additional costs to include are maintenance costs of personnel to monitor, maintain, and service the device, as well as any additional HVAC requirements for heating and cooling. For example, if your solar simulator produces an excess amount of heat that requires extensive sample management, the extra cost (in labour, parts and/or time) of that sample management is something you should include in your solar simulator costing. Additionally, simulators with a high thermal output or high energy consumption may require modifications to the working room air flow and electrical wiring systems to continue to meet occupational safety standards.
Applicability and Flexibility
Finally, it’s worth considering the degree of flexibility and transferability that any solar simulator has for future needs. Do you only need to produce AM1.5G, for now and forevermore? Or is there a chance you might want to investigate different intensities or different reference spectra such as AM0 or others? If so, you should consider how costly it might be to add each potential new spectrum to your simulator. Flexibility has value, and different costs for different solar simulator manufacturers and types.
A flexible solar simulator might also be used for different types of studies, or by different research groups within the same organization or in collaboration with other institutions. At the space agency of France (CNES), for example, a researcher working on star trackers was able to loan their solar simulator to another group working on satellite solar panels.
This resource flexibility or device applicability can have a huge impact on testing for multiple collaborative research groups, if they can split the costs while each gaining the benefits. A single research group might also find benefit in purchasing a solar simulator for use by team members working on widely different applications. For instance, one researcher might use it to test biophotocatalysts and another one to optimize perovskite solar cells.
Additional questions to ask when evaluating a solar simulator include:
- How can I use its functions for other projects or research applications?
- How will its dimensions impact my available work space?
- How will warm-up and cooldown times affect my research schedule?
- What sort of manufacturer support exists now, and will it be there in the future?
- How complicated is the user interface and what functionality does it offer?
- Does it have integration options with cloud-based services, LabView, or self-programmed scripts? What about interoperability options with other laboratory equipment?
Add-ons and Integrated Modules
Finally, it’s worth looking at the value your solar simulator can provide in terms of software add-ons or modules.
Because solar simulators are specialized devices, many manufacturers have integrated IV functionality, EQE, or reference cells that are available for purchase with the instrument. In most cases they have been designed to harmonize with the solar simulator, resulting in significant time savings when it comes to both operation and instrument setup.
It’s worth taking the time to estimate the trade-offs between getting third-party equipment or taking advantage of a solar simulator manufacturer’s offered modules.
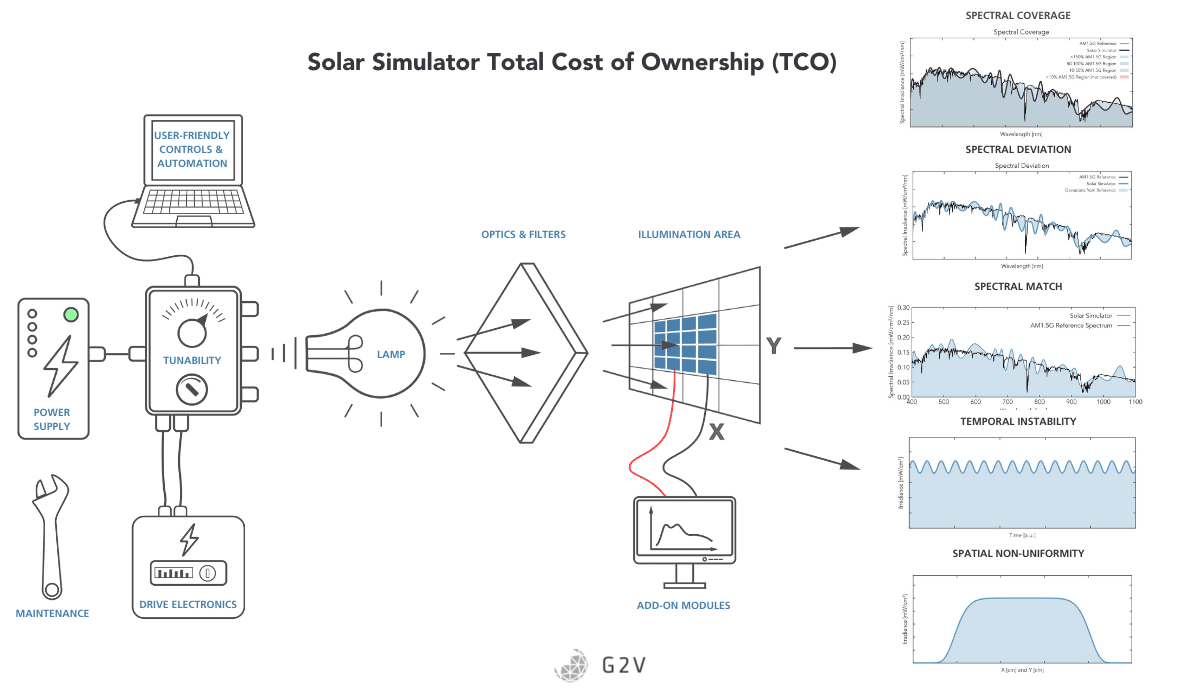
The Bottom Line for Solar Simulator Costing – Total Cost of Ownership (TCO)
A solar simulator that ranks better in all of the classifications and specifications we’ve discussed can mean the difference between a Eureka moment and a rabbit hole of experimental frustration.
Convenience and ease of use, while hard to quantify, can have a major impact. We pay all the time for ease of use and more convenient tools and software applications, whether it’s in purchasing a toaster, or the latest smartphone. The same benefits and justifications apply to solar simulators, too.
The table below summarizes the relative factors associated with some generic solar simulators of each type.
The exact results will vary from one manufacturer to another, but in our experience, there are general trends for each technology type associated with each cost category.
Evaluating these factors against your needs can help you make the most informed decision for your solar simulator purchase.
Consider as many factors as possible when calculating the Total Cost of Ownership (TCO) for your solar simulator.
| Table of Factors Impacting Total Cost of Ownership (TCO) for your chosen Solar Simulator | |||
| Factor | Lamp Type1 | ||
| Incandescent Bulbs | |||
| LED | Xenon Arc | Metal Halide | |
| Initial Cost of Solar Simulator Package | $$–$$$ | $$–$$$ | $$–$$$ |
| Bulb Replacement Cost Times Frequency | $ High replacement cost ($400-$4,000 USD), but infrequent (every ~7 years) |
$$$ Medium replacement cost ($500-$1,500 USD) but very frequent (every ~0.7 years), with supply-chain problems2 |
$$$ Medium replacement cost ($500-$1,500 USD) but very frequent (every ~0.7 years), with supply-chain problems2 |
| Glass Filter Replacement Cost | $ No glass filters used |
$$ (~$1,000 USD each) |
$$ (~$1,000 USD each) |
| Power Supply Replacement Cost x Frequency | $$ Medium cost, very infrequent |
$$$ Sometimes included in bulb Replacement |
$$$ Sometimes included in bulb Replacement |
| Drive Electronics Replacement Cost x Frequency | $$ Medium cost, very infrequent |
$$$ Sometimes included in bulb Replacement |
$$$ Sometimes included in bulb Replacement |
| Cost of Adding Additional Spectra | $–$$ Technology synergizes well with spectral tuning |
$$$ High – requires another glass filter |
$$$ High – requires another glass filter |
| Yearly HVAC costs for electricity and additional heating/cooling | $ Minimal – bulb efficiency results in minimal exhaust heat from solar simulator as well as minimal device heating |
$$$ Extra NIR emission lines result in excess sample heating that needs to be managed |
$$$ Extra NIR emission lines result in excess sample heating that needs to be managed |
| Available extra features or modules | Depends on manufacturer | Depends on manufacturer | Depends on manufacturer |
| User-Friendly Controls | Depends on manufacturer | Depends on manufacturer | Depends on manufacturer |
| LEGEND $ – low cost, $$ – medium cost, $$$ – high cost | |||
| 1. Plasma solar simulators, supercontinuum lasers, and multi-source systems are other types of emerging solar simulator technologies, but not enough academic information was available to provide an objective comparison. | |||
| 2. Reported by some high-intensity discharge solar simulator lamp manufacturers. | |||
Solar Simulator Purchase ROI and Payback Period
So far, we’ve discussed the parameters that contribute to the total cost of ownership (TCO) for a solar simulator, but what’s more difficult to define is the return on investment (ROI) for a solar simulator that provides more accurate research results.
This cost is a bit harder to quantify because it ventures into measurements on less direct and tangible outputs, so we’ll try to focus on the broad concepts to keep in mind.
In general, ROI is calculated by dividing the total benefits by the total costs (including indirect costs mentioned above) over a given time period.
Payback period is generally the total costs divided by the annual benefits.
Costs can be calculated by carefully analyzing the factors we’ve outlined in this article.
What is more difficult to calculate and quantify, however, are the research results.
Research’s Return on Investment
As a researcher, you may have a general sense of how much benefit you can glean from having the right tools for your studies, but quantifying this benefit to make an objective comparison between solar simulator options can be challenging.
The benefits of solar simulators in research applications can be viewed through a number of different lenses.
Accelerating the Pace of Discovery
One lens is to look at their effectiveness on accelerating or easing the overall discovery or testing process during investigations of either basic or applied research. That could be measured tangibly, perhaps, through the number of publications, conference proceedings, or presentations per year. Alternatively, for corporations, it could be measured by the net annual profit from a new product.
However, the above considerations still leave out other factors such as researcher happiness and motivation related to the use of the instrument as well as any additional corrections needed to translate the results from solar simulator lab testing to expected results under more complex real-world environments.
Societal Impact of Research
Another lens is to look more broadly at the societal impact of research. This could include the training of graduate or summer students and the net economic impact of the adoption of a piece of new technology in particular applications [Sammis, T. et al. 2013]. This type of societal impact is generally only estimable for applications-based research [Sammis, T. et al. 2013], where there is a tangible desired outcome. For basic or fundamental research, where investigators are seeking to understand the underlying phenomena of a facet of the universe, the net benefits are difficult if not impossible to measure.
An Example Solar Simulator TCO Calculation
To put some more concrete framing around Solar Simulator Total Cost of Ownership (TCO) and return on investment (ROI), let’s consider two typical solar simulators A and B.
First, we need to specify a hypothetical application. Let’s say that we want to use a large area solar simulator (between 600 cm2 – 700 cm2) to test multi-junction solar cells. Multi-junction solar cells require probing of junctions at specific wavelengths. Therefore, the ability to turn on and/or adjust specific wavelength regimes is a big asset.
Since the potential revenue, profits and/or benefit of the researched solar cell is wildly difficult to estimate and parametrize, we’ll restrict the initial discussion to the total cost of ownership of the solar simulator (TCO), and then use a comparison of the TCO for the two solar simulators in order to estimate ROI and payback period.
First, let’s specify a bit more about the performance and costs of the two solar simulators we’re considering for our multi-junction testing.
Typical LED Solar Simulator A
Solar simulator A has a higher capital cost of $45k, and is representative of a typical large-area LED solar simulator. It has a lamp lifetime of 10,000 hours and a relatively high lamp replacement cost of $4.1k (including the technician time to replace and test the system). If we assume the solar simulator is operated for 6 hours a day, 5 days a week (excluding holidays), then the LEDs will have to be replaced once every 7 years. This works out to an annual lamp replacement cost of roughly $600. Because the solar simulator uses LEDs for spectral reproduction, there are no additional costs for glass filters. Over a 10-year period, the total associated maintenance is therefore $6,000.
Solar simulator A consumes 0.6 kW of power. If we assume nominal costs for electricity ($0.174/kWh) we get a total power consumption per year of about $150, or $1,500 over a 10-year period.
With these values in mind, we can calculate an approximate total cost of ownership (TCO) for solar simulator A over a 10-year period.
|
Capital cost |
$45,000 |
|
Maintenance cost over 10 years |
$6,000 |
|
Power consumption over 10 years |
$1,500 |
|
Total Cost of Ownership (TCO) |
$52,500 |
Before moving on, let’s also talk about some additional operational costs that don’t necessarily factor obviously into the TCO above.
Let’s say that solar simulator A takes 5 minutes to warm up. If we assume 3 turn-ons per day of operation, and the same nominal costs for electricity ($0.174/kWh) and technician time ($30/hour, which represents the sum of user time and any service lab booking fees), the cost of warm-up time each year is $1,800. The exact amount might differ from one lab to another, but the point is that this is a recurring operational cost that’s not productive.
This solar simulator is LED-based, so let’s assume it takes advantage of one of the chief benefits of LED-driven solar simulators, i.e. the ability to easily turn on and adjust individual wavelength bands. Therefore, its feature set is well-matched to our hypothetical application of measuring multi-junction solar cells. While it’s hard to precisely quantify its benefit, it is clear that this solar simulator will greatly ease and accelerate the work on multi-junction cells.
Typical Xenon Solar Simulator B
Solar simulator B has a capital cost of $35k — slightly lower than the LED solar simulator because xenon arc lamp solar simulators have been in the market longer. Xenon arc lamps have a much shorter lamp lifetime of 1,000 hours and an approximate bulb replacement cost of $1,600 (including the time to install and test a new bulb). If we assume the same operating conditions as solar simulator A above (6 hours per day for 5 days a week excluding holidays), then the xenon bulb will last 8.5 months.This works out to a net bulb cost per year of $2,300.
However, solar simulator B has an additional maintenance cost: the replacement of the filters it requires to produce different spectra. Let’s assume there’s only one $1,000 filter with a lifetime of 10,000 hours. This will last 7 years and cost roughly $160 per year.
Therefore, the total maintenance cost per year, for bulbs and filters, is about $2,500.
Solar simulator B consumes 1.6 kW of power (based solely on the wattage of the xenon bulb necessary to illuminate an equivalent area). If we assume nominal costs for electricity ($0.174/kWh) we get a total power consumption per year of about $400, or $4,000 over a 10-year period.
With these values, we can now calculate an approximate total cost of ownership (TCO) for solar simulator B over a 10-year period.
|
Capital cost |
$35,000 |
|
Maintenance cost over 10 years |
$25,000 |
|
Power consumption over 10 years |
$4,000 |
|
Total cost of ownership (TCO) |
$64,000 |
As we did with solar simulator A, let’s discuss the impact of warm-up time.
Solar simulator B takes 30 minutes to warm up, in part because xenon lamps produce an excessive amount of heat that needs equilibration. If we assume the same parameters we did for solar simulator A, i.e. 3 turn-ons per day of operation, and the same nominal costs for electricity ($0.174/kWh) and technician time ($30/hour), the cost of warm-up time each year is $10,700. In a busy research setting, where multiple students or staff must book equipment time, long instrument warm up times are a serious drain. Again, this is a recurring operational cost that’s not productive.
As far as its suitability for multi-junction solar cell testing, solar simulator B will have challenges. In order to activate certain wavelength bands, different types of filters will need to be purchased, installed, and calibrated. Depending on the wavelength ranges of interest and the required precision in spectral tunability, additional tuning compliments like external lamp sources may be required, increasing the required instrument booking time, and potentially doubling the initial solar simulator investment.
Comparing TCO of Solar Simulators A and B
Even though the sticker price of solar simulator B was lower ($35k vs $45k), its total cost of ownership (TCO) is actually more than $10k higher over a 10-year period. This cost is multiplied if multiple simulators are needed for a particular project or institution.
Recurring costs are important to consider, financially speaking, for smaller research groups with fixed funding. These savings can be the difference between funding a student, purchasing reagents, running additional tests, requiring additional grants – or not.
For larger groups, this financial consideration may not be a deal-breaker; instead, these larger groups are more likely to focus on the inherent technological advantage one solar simulator will have in research. In both types of groups, a responsible long-term expenditure plan of taxpayer funds or company assets should be considered.
A solar simulator is just one tool in the arsenal of instruments needed for research and when making a purchase decision, a group must consider the cumulative cost of all their instruments. Over the long turn, savings in one area can offset higher expenses in other areas or enable wider resource allocation to other projects.
This example illustrates the importance of considering more than initial capital expense when making a solar simulator purchase decision.
Additionally, as the consequences of climate change are better understood, there is an argument for researchers to be environmentally conscientious and reduce their carbon footprints. The constant manufacture, transport, and replacement of electronic parts represents a cost to the environment in terms of raw materials, energy-intensive manufacturing, and waste disposal. Therefore, researchers may want to price-in socially responsible alternatives in their research.
Now that we have some comparative values for the two cases, let’s look at the possible return on investment for purchasing solar simulator A at an initially higher price.
An Example Solar Simulator ROI Calculation
Comparing A to B indicates that solar simulator A requires additonal capital of $10k.
However, we saw that the annual maintenance of solar simulator A is $600 compared to $2,500 for solar simulator B, which means we can save $1,900 per year with solar simulator A just in maintenance alone.
Furthermore, solar simulator A has reduced power consumption ($250 less per year) and less warm-up time ($8,900 per year).
If we add up all these differences, we save $11,050 per year by choosing solar simulator A – more than the difference in their initial capital expense!
|
Solar Simulator A |
Solar Simulator B |
Difference: A vs B |
|
|
Initial Capital Expense |
$45,000 |
$35,000 |
-$10k |
|
Annual Maintenance |
$600 |
$2,500 |
+$1,900 |
|
Annual Power Consumption |
$150 |
$400 |
+$250 |
|
Warm-up Time |
$1,800 |
$10,700 |
+$8,900 |
|
Total Annual Benefit |
+$11,050 |
If we use these cash flows (-$10k for year 1, and +$11k every year thereafter) to calculate an initial rate of return (IRR) [Fernando 2021], we get 108% IRR for the first 5 years, and 111% IRR over a 10-year period. The payback period [Kagan 2021] of choosing solar simulator A over solar simulator B is 0.9 years.
We recommend that you consult a financial expert if you require more exact details on these calculations, but at a glance the numbers make sense — each year you’re saving roughly the same ($11k), and those savings will compensate for the extra initial purchase cost in roughly 1 year.
In brief, solar simulator A provides a good return on investment compared to solar simulator B, and will pay for itself in short order. If an exact calculation of this nature is important to your investigation, be sure to work with financial experts to develop an accurate model.
The key conclusion is that a higher-quality solar simulator, while perhaps more costly upfront, can ultimately provide a larger return on investment, and will pay for itself quickly due to its increased efficiencies and reduced operational costs.
Final Thoughts: The Value of Good, Fast Solar Testing
While financial considerations play a key role in the purchase decision, there are other benefits solar simulators might provide that are difficult to translate directly into financial terms but that are equally as important.
Let’s qualitatively consider the value of functionality and ease of operation.
Instrument weight, size, height, safety requirements and sensitivity to external perturbations are all important factors to consider when introducing a new instrument in the laboratory.
Not every instrument is suitable for the available lab space, nor will every instrument have the required surrounding environment to integrate and perform well. If an instrument requires extensive light blocking or safety goggles for anyone in the same room, it might not be suitable for a high-traffic, densely-packed instrumentation lab.
Earlier in this article, we discussed some of the impacts that a solar simulator’s technology type might have on research, and whether that will result in accurate, fast testing or not. Similarly, we discussed some of the flexibility and application considerations that will also determine how aligned a solar simulator is to doing certain kinds of research. In general, most users want to avoid any uncertainties or inaccuracies introduced by a solar simulator, since these ultimately result in a higher cost for research and development.
The costs associated with simply getting a solar simulator’s illumination working as expected could be transferred instead to exploring deeper scientific or commercial questions. Those hours, days, and weeks of installing, replacing, calibrating, adjusting outputs, finding parts, waiting on quotes, placing orders, waiting on shipments, clearing payments, and post-processing any measured data could be better spent by researchers planning their experiments and jumping straight into analysis of the phenomenological nature of their results.
The key purpose of a solar simulator is to enable accurate testing, accelerate development, and support research.
A good simulator must match or exceed the standards for spectral match, spatial non-uniformity, temporal instability, spectral deviation, and spectral coverage.
A great simulator must include integrated modules for application-specific testing and user-customizable software.
A superb simulator should be easy to use and require little maintenance.
Quick Summary
- When comparing solar simulators, make sure you are comparing their true performance and quality — Class AAA solar simulators can vary widely from one manufacturer to another and the use of the new spectral coverage and spectral deviation parameters from IEC 60904-9:2020 can help differentiate passable from exceptional solar simulators.
- The cost of a solar simulator is more than just the initial capital investment — there is also ongoing maintenance and operation, lamp replacement, recalibration, and electronics or optics replacement.
- It’s important to consider the extra value from add-ons, integrated modules or spectral flexibility that might allow for more rapid, accurate testing.
- The opportunity cost of having to spend more time debugging or correcting for your solar simulator non-uniformities or mismatches can’t be understated.
- The net benefit of a better solar simulator is its ability to accelerate good research and testing — be sure to include this in your considerations along with the many other factors to compute ROI and total cost of ownership (TCO).
***
We hope this article has provided you with a broader picture of all the factors involved when pricing out a solar simulator, so you can maximize the return on your solar simulator investment and achieve better test results.
Download our PDF Checklist for your Search
Download our PDF criteria for your personal reference when requesting quotes for solar simulators to ensure you’re getting an accurate picture of the capabilities and costs/benefits of any solar simulator you’re considering.
Click below to get access to the PDF (no email required)
References
Aghassi, A., and Fay, C. (2019). Effects of IPA treatment on the photovoltaic performance of bulk heterojunction organic solar cells. Journal of Physics and Chemistry of Solids, 130, 136-143.
ASTM E490-00a. (2019). “Standard Solar Constant and Zero Air Mass Solar Spectral Irradiance Tables”, ASTM International, West Conshohocken, PA, www.astm.org
ASTM E927-19 (2019), “Standard Classification for Solar Simulators for Electrical Performance Testing of Photovoltaic Devices”, ASTM International, West Conshohocken, PA, www.astm.org
ASTM E1021-15 (2019), “Standard Test Method for Spectral Responsivity Measurements of Photovoltaic Devices,” ASTM International, West Conshohocken, PA, www.astm.org
ASTM G173-03. (2020). “Standard Tables for Reference Solar Spectral Irradiances: Direct Normal and Hemispherical on 37° Tilted Surface”, ASTM International, West Conshohocken, PA, 2020, www.astm.org
Bliss et al. (2008). “Advantages in using LEDs as the main light source in solar simulators for measuring PV device characteristics”, Solar Energy and Applications, San Diego, CA. http://proceedings.spiedigitallibrary.org/proceeding.aspx?doi=10.1117/12.795428
Emery, K.A. (1986). Solar Simulators and I-V Measurement Methods / Device Performance, Solar Cells, 18, 3-4. Retrieved online on 2021-06-25 from https://www.nrel.gov/docs/legosti/old/8666.pdf
European Commission Joint Research Centre. (2010). Guidelines for PV Power Measurement in Industry. Compiled Report.Retrieved online on 2021-06-25 from https://op.europa.eu/s/rX8a
Fernando, J. (2021). Internal Rate of Return Definition & Formula. Investopedia. Retrieved online on Sep 20, 2021 from https://www.investopedia.com/terms/i/irr.asp.
IEC. (2020). 60904-9: Classification of solar simulator characteristics.
Kagan, J. (2021). Payback Period Definition. Investopedia. Retrieved online on Sep 20, 2021 from https://www.investopedia.com/terms/p/paybackperiod.asp.
Leary, G. et al. (2016). “Comparison of xenon lamp-based and led-based solar simulators”, IEEE 43rd Photovoltaic Specialists Conference (PVSC), Portland, OR. http://ieeexplore.ieee.org/document/7750227/
Reese, M.O., Marshall, A.R., and Rumbles, G. (2017). Chapter 1: Reliably Measuring the Performance of Emerging Photovoltaic Solar Cells, in Nanostructured Materials for Type III Photovoltaics, 1-32. Retrieved online on 2021-06-25 from https://pubs.rsc.org/en/content/chapterhtml/2017/bk9781782624585-00001?isbn=978-1-78262-458-5
Sammis, T., O’Neill, M., and Wang, J. (2013). Research Report 781: Estimating Economic Value of Applied Research Projects. NM State University, Agricultural Experiment Station. Retrieved online on 2021-06-25 from https://aces.nmsu.edu/pubs/research/economics/RR781.pdf
Ye, S. et al. (2020). Resolving Spectral Mismatch Errors for Perovskite Solar Cells in Commercial Class AAA Solar Simulators, J. Phys Chem. Lett. 11, 10, 3782-3788. Retrieved online on 2021-06-25 from https://pubs.acs.org/doi/10.1021/acs.jpclett.0c00355#