Class AAA Standards for Solar Simulators
When searching for a solar simulator, you will continuously come across the term “Class AAA” rating – but what does it mean? If you’re unsure what that is and how it applies to your research, this chapter is for you. If you prefer to take in content in video form, this section, “A Look at the Key Standards of Solar Simulation,” is covered by Dr. Mike Taschuk.
The standards are set by governing bodies such as ASTM, IEC, and JIS and are used to determine the quality and accuracy of a solar simulator device’s illumination. The specific standards that govern solar simulation are JIS-C8912, IEC 60904-9, and ASTM-E927-10.
Some classes you may see range from Class C to Class AAA, depending on the solar simulator – which may lead one to think that a Class AAA simulator is better than a Class A simulator.
In fact, “Class AAA” is a shorthand for three different parameters of the standard, meaning Class A Spectral Match, Class A Spatial Uniformity, and Class A Temporal Stability.
While the ASTM, IEC, and JIS standards vary slightly, the overlapping minimum requirements for each Class are tabulated below:
|
|
Spectral Mismatch To All Intervals |
Spatial Non-Uniformity (%) |
Temporal Instability Short Term (%) |
Temporal Instability Long Term (%) |
|
A |
0.75 – 1.25 |
2 |
0.5 |
2 |
|
B |
0.6 – 1.4 |
5 |
2 |
5 |
|
C |
0.4 – 2.0 |
10 |
10 |
10 |
Class A Spectral Match
The spectral match is a measure of accuracy between the output of a solar simulator and a target spectra. It is evaluated using the amount of light produced within specific wavelength bands compared to the standard spectra and reported as a “spectral mismatch”.
Most scientific research uses the AM1.5G spectra. However, research in different environments (like in space—AM0, on the surface of Mars, or subsurface aquatic environments) each has different spectral profiles. Some solar simulators have tunable spectra—learn more about this in this variable spectra section.
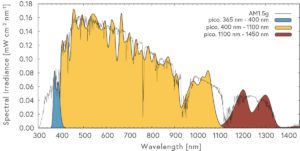
To calculate the spectral match of a solar simulator to the AM1.5G spectrum, the 400 nm—1100 nm region is divided into six wavelength bands. Each band must contain a particular percentage of the total integrated irradiance between 400 nm and 1100 nm. Spectral Match (SM) is calculated as the ratio of the actual percentage of irradiance falling on the interval measured and the required percentage of irradiance.
Based on the value of spectral match obtained from the equation, the solar simulator may be classified as class A, B or C for spectral match.
The Class A spectral match requires a factor of 0.75 – 1.25 between the artificial light source and the standard spectra in each wavelength region.
If your research focuses on improving solar cell efficiency for energy production, you can improve the link between your results and real-world applications by utilizing the spectral match provided by a Class AAA solar simulator.
Class A Spatial Uniformity
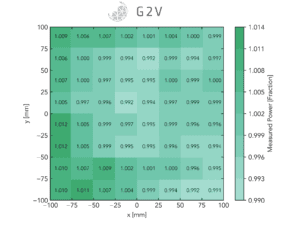
Spatial uniformity describes the distribution and consistency of irradiance over an area. The parameter is reported as “spatial non-uniformity” and is calculated from the difference of the maximum and minimum irradiance values in an area.
Spatial uniformity ensures an even light distribution across an entire experimental area. The Class A should have a spatial non-uniformity of less than 2%. Solar simulators may have a total illumination area that is much larger than the Class A uniformity area, so it’s vital that the high-uniformity area can cover your samples.
To quantify the spatial non-uniformity of a solar simulator, the irradiance of the simulator beam over the test area is mapped. The test area is divided into a grid of measurement positions, and the following equation, found on the standards, is applied to calculate the non-uniformity in percentage terms.
The number of measurement positions depends on the size of the test area and the standard being used.
Class A Temporal Stability
Temporal Stability is the consistency of light output over a period of time.
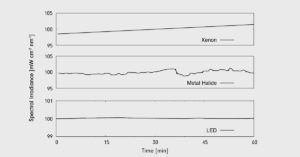
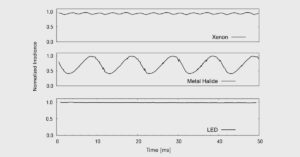
Traditional solar simulators (e.g., Xenon, metal halide, or tungsten bulb-based lamps) are known for changing spectra and drifting intensity over time, whereas more advanced LED technology has substantially better stability and longer lifetime.
Instability Time Minute Scales
Another thing to consider is that different light sources have different temporal stability at different time scales (minute vs sub-second time scales). For example:
- Xenon lamp is unstable on a minute time scale but has relatively better stability on a sub-second time scale
- A metal halide lamp is unstable on a minute time scale and very unstable on a sub-second time scale
- An LED light source is stable on both minute and sub-second scales.
Instability Sub-Second Scales
Whether performing experiments that require several months of continuous light or testing multiple devices consecutively, you would require the lowest temporal instability to gather accurate data on your devices’ performance.
Two parameters are used for measuring temporal stability: short-term instability (STI) and long-term instability (LTI).
STI relates to the data sampling time of a data set (irradiance, current, voltage) during a current-voltage (I-V) measurement. This value of temporal instability may differ between data sets on the I-V curve. STI is determined by the worst case in this situation. For batch testing of modules or solar cells without irradiance monitoring during I-V measurement, the STI is related to the time period (minutes to hours) between irradiance determination.
LTI is related to the time period of interest. For I-V measurements, this refers to the time taken to measure the entire I-V curve. The irradiation exposure test is related to the exposure period (hours to months). The following equation is used when determining the temporal instability of irradiance (in percent):
When choosing the proper solar simulator for your research, the Class AAA rating is necessary, but depending on your experiments, it may not be sufficient. Some solar simulators offer performances that surpass Class AAA rating in spectral mismatch (smaller range than 0.75-1.25), spectral non-uniformity (less than 2) and temporal instability (less than 0.5 for short temp and less than 2 for long term). It’s important to consider how the limitations in the classifications may impact your results, especially if your research is sensitive to changes in time or responds to different spectral ranges.
This covers the Class AAA standard presented by IEC 60904-9:2020. If you want to learn more about Class AAA quality, head over to our LED solar simulators page.
Our next chapter will jump into areas of applications you commonly find solar simulators.
